This document is In-Progress.
This document is a version update from v.6.0.1 to v.6.7.0 - July 2020.
Contents
Overview
The CCC Report Center is an easy-to-use tool with ready-to-use standard reports that allow you to report on submitted CCCApply (Standard and International) and BOG Fee Waiver student applications and school information. You can also create your own reports by either starting with one of the standard reports' Views or by creating your own report View from scratch.
The CCC Report Center is powered by JasperReports, a Java-based open-source reporting tool. JasperReports allows for advanced reporting usage and provides extensive help that you can access from the Help link. The information provided in this document serves as a "Quick Start" guide to your CCCApply-specific needs.
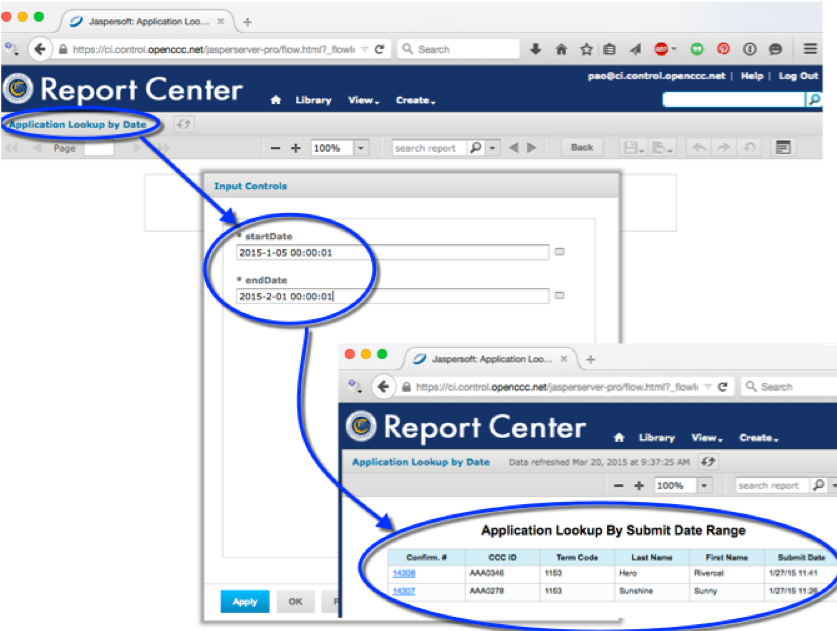
The image below is an example of the kind of report you can run in the CCC Report Center. This report shows the results of looking up student applications submitted in a specific date range.
Terms of Use and Support
The OpenCCCApply Pilot environment is meant to be a carbon copy of the Production environment to allow colleges to stage changes in their configurations and test implementations prior to an update or product roll-out. While the Pilot environment is a clone of Production, it is not actively monitored for errors and issues in the same way that the Production environment is. Thus, there is no support team in place to respond to Pilot environment issues. For those colleges currently implementing OpenCCCApply, reporting issues to your project team may not be effective.
Our recommendation is that college staff personnel use the CCCTechnology.info support site to communicate issues, ask questions, and request assistance. CCCTC support staff review incoming posts and endeavor to respond within 48 hours to issues posted about the Pilot environment. Depending on the nature of the issue, resolution time will vary; however the intent is to provide updates on progress towards implementation every 24 hours.
Making XAP Applications Available in Reporting
It is expected that if you have any legacy XAP-based student applications they have been imported into your Student Information System (SIS) and are available for reporting. XAP-based student applications have their own unique Data Dictionary and application data download process. Contact the CCC Tech Center to request Data Dictionary and/or download process information if necessary.
Accessing the CCC Report Center
You can access the CCC Report Center data for your college in two different environments: Pilot and Production.
The Pilot environment allows you to experiment with CCC Report Center functionality in a test environment while you learn to use the tool.
The Production environment allows you to report on live data for submitted student applications and school information.
Note: The OpenCCCApply Pilot environment is meant to be a carbon copy of the Production environment to allow colleges to stage changes in their configurations and test implementations prior to an update or product roll-out. While the Pilot environment is a clone of Production, it is not actively monitored for errors and issues in the same way that the Production environment is. Thus, there is no support team in place to respond to Pilot environment issues. For those colleges currently implementing OpenCCCApply, reporting issues to your project team may not be effective.
Our recommendation is that college staff personnel use the CCCTechnology.info support site to communicate issues, ask questions, and request assistance. CCCTC support staff review incoming posts and endeavor to respond within 48 hours to issues posted about the Pilot environment. Depending on the nature of the issue, resolution time will vary; however the intent is to provide updates on progress towards implementation every 24 hours.
Logging In
Navigate to the URL provided by your IT staff for either the Pilot or Production environment.
At the login screen, enter your college credentials for the username and password.
Click the Sign In button.
Add User Setup
A designated person (or persons) at your school will have been configured by the CCCTC as a user with "add authority," and will be able to add other CCC Report Center users. The person with "add authority" for your school will use the following steps to add CCC Report Center users (these steps are also documented in the Administrator guide):
Log in to the Administrator.
Select CCC Report Center from the Select an Application drop-down list.
Select your college from the Select a College drop-down list to display the Users tab.
Click the Users tab to select it and to display the User fields.
Enter a unique EPPN in the EPPN field for a new user.
Select Data Use Only from the Authorization Type drop-down list to assign the new user the ability to use CCC Report Center reporting functionality. OR, select Add User Authority from the Authorization Type drop-down list to assign the new user the ability to use CCC Report Center reporting functionality AND the ability to add other CCC Report Center users.
Select your college's MIS code from the Authorized MIS Code drop-down list. If you are setting up a user for a District instead of an individual college, then you will select the District MIS code. District MIS codes end in '0'. District-level users can access and report on data for all the colleges in the district.
Note: The CCC Report Center is configured for single-sign on, which means that the user ID and password you use to access your college accounts are the same as those you use to log in to the CCC Report Center.
Navigating the CCC Report Center
The Home Page
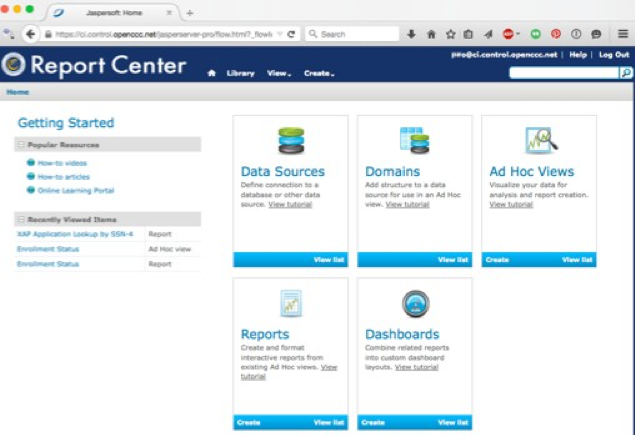
The CCC Report Center Home page displays the following items:
A Getting Started section (with links to JasperReports community resources) and links to recently-viewed items
Resources options for defining data sources, structuring data sources, Ad Hoc Views, Reports, and Dashboards
Links across the top of the CCC Report Center to the Library, View, and Create features
Note: It is expected that most CCC Report Center users will use the Ad Hoc Views, Reports, and Dashboards resources.
Navigation
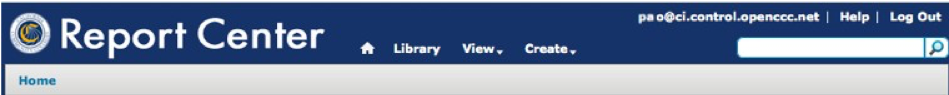
When you log in to the CCC Report Center, the title bar across the page includes your user ID, a Help link, a Log Out link, and a search bar.
Click the Help link to open the Introduction page for the JasperReports Server help web site in a new browser window.
Click the Log Out link to log out of the CCC Report Center.
Enter search text in the search bar and press the Enter key or click the Lookup icon to display search results.
Tip: Wherever you are located in the CCC Report Center, you can always click the Home icon to return to the Home page.
Accessing Reports
There are three ways to access the reports in the CCC Report Center:
Library link
View -> Repository link
Search bar
Access Point | Description |
|---|---|
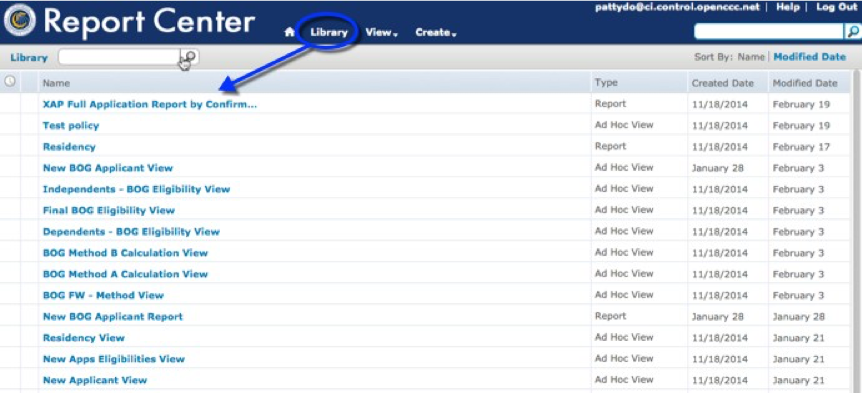
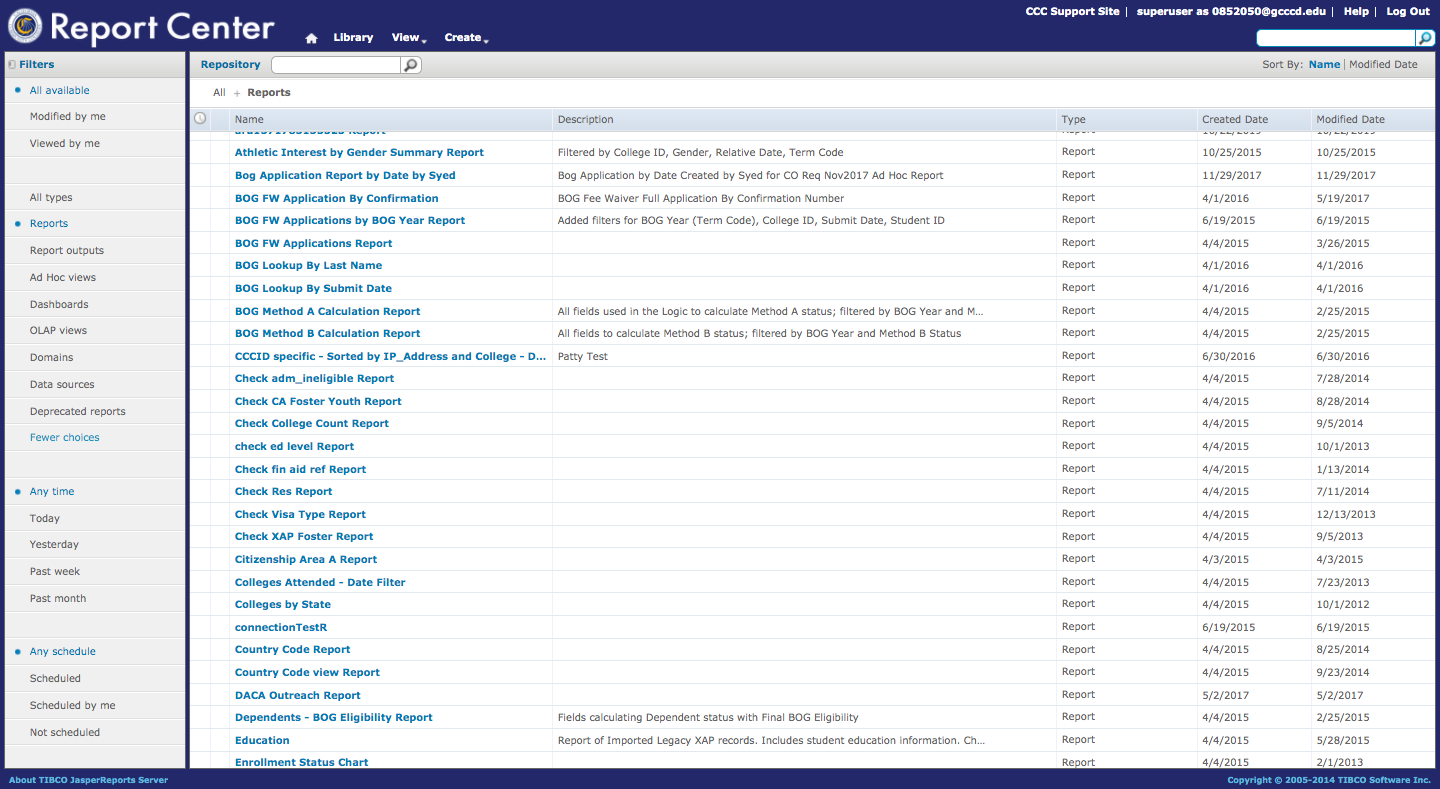
The Library Link | The Library link displays a list of all available reports and their corresponding Views. By default, the list is sorted ascending by Name. To sort the list by the date each report was last modified, click the Modified Date link (which toggles to display Name as the active link). |
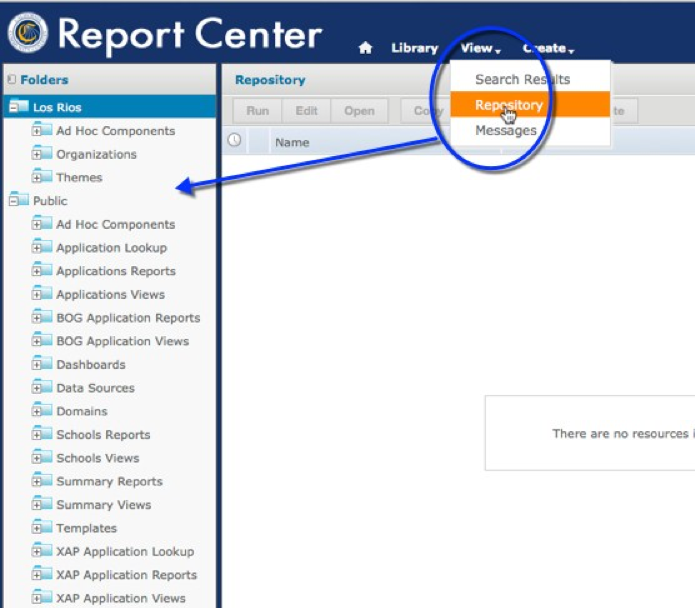
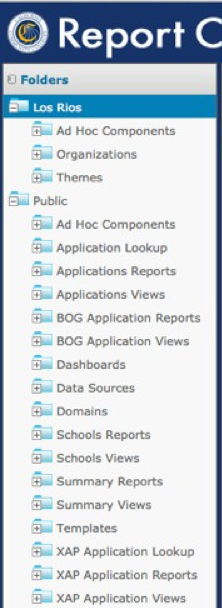
The View > Repository Link | Clicking the View link displays drop-down list options of Search Results, Repository, and Messages. When you select Repository, the available reports display in two categories: your college(Los Rios in the example image below), and Public. |
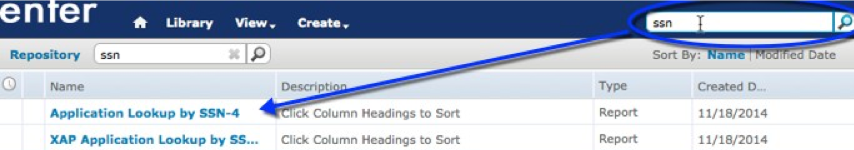
The Search bar | Entering a search value in the Search bar returns reports in the Repository view that match the search criteria. |
The Library
The Repository
The Search Bar
Success: Clicking the linked report name for a report opens the report.
College & Public Folders
For the purposes of this "Quick Start" guide, it is assumed you are accessing reports by clicking View -> Repository to view the Public and college reports.
Reports & The Report Viewer
The CCC Report Center makes it easy to run reports. When you run a report, it opens in the interactive Report Viewer. With the Viewer, you can personalize and refine the displayed report data. If the report has filers (input controls), you run the report with one set of data and then another.
Report Viewer
The Report Viewer allows you to view a report, export content to various output formats, and apply formatting, sorting, and filters to control how the data is displayed.
To open a report in the Report Viewer:
Locate your report in the library or repository.
Click the report name, or right-click the report name and select Run. In the repository, you can also click the report row and select Run from the tool bar. The report opens in the Report Viewer.
Running or Creating a Report
You can view and work on a report in the Report Viewer in a number of ways:
Running an instance of an existing report
Creating a new report from an existing Ad Hoc view
To run a report:
Log into the CCC Report Center with your authorized user account.
On the Home page, click the large icon in the Reports block.
The search results appear, listing your own college resources and all the public resources that your user account has permission to access.
If you are running a report with multiple pages, the first page of the report appears before the entire report is loaded. You can begin scrolling through report pages as they load, as indicated in the pagination controls in the upper left corner of the Report Viewer. If you want to cancel loading the report before it is complete, click the Cancel Loading button that appears next to the pagination controls.
IMPORTANT: Table reports are limited to display a maximum of 20k rows. To ensure your report has fewer than the maximum rows allowed, add one or more filters (Input Controls) into your Ad Hoc View design.
Table & Crosstab Reports
A table report is a simple, tabular report that lists application data.
Navigating the Report
If your report has multiple pages, you can use the pagination controls to move through the report quickly.
To navigate the published report:
Image | Action |
|---|---|
Use at the top of the Report Viewer to navigate to the previous page. | |
Use to navigate to the next page. | |
Use to go to the end of the report. | |
Use to go to the beginning of the report. | |
If you know the number of the page you want to view, enter the page number in the Current Page indicator box. | |
Exporting the Report
To export the report:
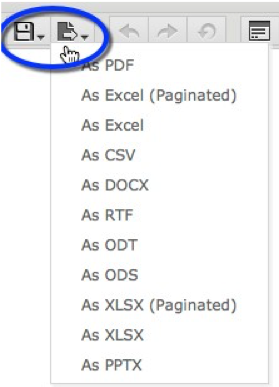
To view and save the report in other formats, click the Export button.
Select an export format from the drop-down. The export options are listed in “Export File Types” list below.
Option | Format Name | Usage |
Adobe Acrobat | Choose a report template based on report size. Use the Actual Size report template for reports with dimensions less than or equal to 14400px by 14400px. See Report Templates for more information. | |
Excel (Paginated) | XLS | Not recommended for exporting most tables or crosstabs. Repeats headers and footers on each page. |
Excel | XLS | Ignores page size and produces spreadsheet-like output. |
CSV | Comma Separated Values | Characters outside the Latin 1 character set can cause the Excel spreadsheet to look unacceptable. Try saving the file and importing it using Excel's Import functionality. |
DOCX | Word | Do not export reports having more than 63 columns. In Microsoft Word, you cannot create tables having more than 63 columns. |
RTF | Rich Text Format | Creates a large output file and, therefore, takes longer to export than PDF, for example. |
ODT | OpenDocument Text | For best results, minimize the number of rows and columns and make sure they don’t overlap. |
ODS | OpenDocument Spreadsheet | Same as ODT. |
XLSX (Paginated) | Microsoft Open XML Format Spreadsheet | Not recommended for exporting most tables or crosstabs. Repeats headers and footers on each page. |
XLSX | Microsoft Open XML Format Spreadsheet | Ignores page size and produces spreadsheet-like output. |
PPTX | Microsoft PowerPoint Presentation | Each page of report becomes a slide in the PowerPoint presentation. |
Save the report in the export file format, for example PDF, or open the report in the application.
Creating a Report
You can create a custom report directly from the Report Center Home page. This method allows you to select an existing Ad Hoc view and generate a report from it, without going through the Ad Hoc Editor.
To create a report from the Home page:
On the Home page, click Create in the Reports block. The Create Report wizard opens.
Select the Ad Hoc view you want to use as the basis for your report.
Select a report template. To use a template other than the default, select Custom Report Template, click Browse and select the desired template.
Click OK. If asked, enter data in the filters (input controls) as needed.
You can now begin working with your report.
The report shown below was created using the Ad Hoc Editor. As this type of report runs, you can interact with it in the Report Viewer to visualize the data in different ways. Column formatting allows you to highlight certain columns and fields, and filtering and sorting report output on‑the‑fly can provide timely views of the data that answer your questions. For example, suppose you’re running the New Applicants public template report and want to know how many applicants have a permanent address outside of California. Highlighting the State column with red text and filtering it to show only the states that are not “CA” would reveal this data.
Formatting a Report
Column Formatting
You can customize the basic format of column headings and fields, using the Format Column dialog. Hover over and click Formatting... The Format column dialog appears.
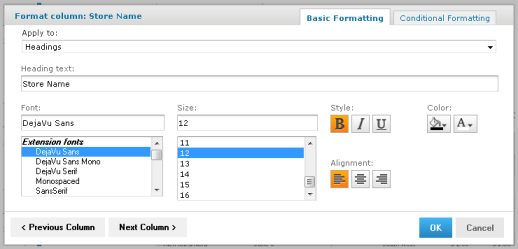
You can alter a column’s basic formatting or apply conditional formatting to a column.
In longer reports, columns have floating headers. If your report extends past your browser frame, use the vertical scroll bar to move up and down the list. If you do not see a vertical scroll bar, try increasing the width of your browser window.
Column formatting options include:
Text
Font type, size, and style
Background color
Font color
Text alignment
To customize your column formatting:
Run your report, so it opens in the Report Viewer.
Click the header in the column you want to format.
Hover over and click Formatting...
Click the Basic Formatting tab, and change the following options if needed:
Apply to – Select the part of the column you want to apply the formatting to.
Heading text – Type new heading text to replace the current text
Font – Scroll through the menu to select a font.
Size – Scroll through the menu to select a font size.
Style – Click to select Bold, Italic, or Underlined text.
Background Color – Click to open the background color picker, then click to select the background color.
Font Color – Click to open the font color picker, then click to select the text color.
Alignment – Click to select Left, Center, or Right alignment.
If needed, click Previous Column or Next Column to change the formatting for an adjacent column.
Click OK.
Conditional Formatting
Understanding Ad Hoc Views
In order to create a report you must first create a View, and then create a report from it. A Report View is a kind of "report designer" that defines the type of report and the format, layout, data, groupings, and filters to be applied when the report is generated.
Once a report is created, it can be run immediately, run in the background, scheduled, or included on a dashboard. Reports can be scheduled to run at any interval you define. Scheduled reports can also be distributed via e-mail to specified recipients.
Public Reports
Public reports include ready-to-use standard reports that have already been created for you, along with their corresponding Views. For example, in the image above, the Summary Reports subfolder is followed by a Summary Views subfolder. Each report in the Summary Reports subfolder has a matching View in the Summary Views subfolder.
You can copy existing Views, renaming them to create a new View where you can add or remove fields. Or, you can create your own new Ad Hoc View from scratch.
Details for using Views and their reports are included in the sections below, but in general, use the following "best practices" when working with Views and reports:
Keep your Views organized in folders that have the word "View" in their name to make the Views easier to find
Keep your reports organized in folders that have the word "Reports" in their name to make the reports easier to find
Use the same name for the View as you do for its corresponding report but include "View" or "Report" in its name to further help with organization
If you change a View, you will need to create a report from it in order to see the changes in report form
If you want to keep the original View when making changes, use the Save As button to save the View with a different name and then make your changes (and use the Description field in the Save As dialog box to add information)
Public reports and their Views cannot be edited or deleted (though in some reports you may have the option to filter out certain data from the displayed results)
Only copy a report's View if you need to edit or customize it; otherwise, always run a Public report from the Public folder in the Repository
When copying or customizing an existing View, add the word "Report" or "View" onto the end of the new name to keep the report/View distinction clear
Running a Public Report
When you first log in to the CCC Report Center, you will find a number of pre-defined standard reports in the Public folder. You can run any of these reports. A public report that is associated with submitted student applications will display data only for applications submitted to your college. Most of the Public reports have filters that restrict the output to a subset of your college's submitted student applications.
Follow these steps to run a Public report:
Click the Public folder to expand it and display the sub-folders that contain standard reports.
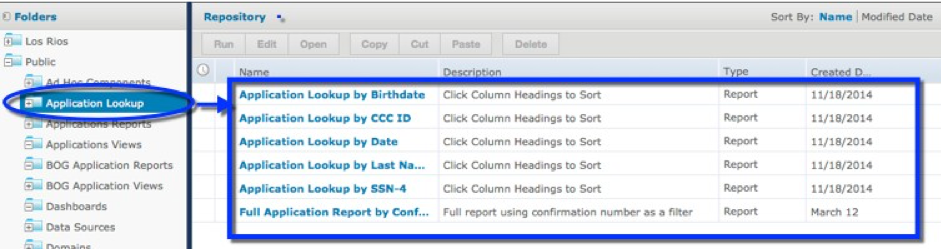
Click the subfolder name to display the report options for that report type in the Repository list.
Click the report Name link in the Repository list to run the report.
If the report you selected prompts you for input (such as the Lookup reports), then you will need to click the OK button to close the Input Controls dialog box that displays prior to running the report.
You can then save the report or export the report into a variety of file formats.
Note: When you run a report that prompts you to enter a date and time, even if you do not need to use time as a measure for your results, you must enter at least 1 second in the time field in order for the report to return results properly.
The following types of reports are available in the Public folder:
Application Reports: These include some common "detail" reports of submitted applications. Many of these reports include Lookup fields that prompt you for your report criteria.
Summary Reports: These include some commonly-requested summaries, typically including charts and crosstab reports.
Schools Reports: These allow interactive searches of the School database table used in the CCCApply School fields. You can search (query) the School database table using a variety of different filters. These reports are not unique to any college.
College Reports
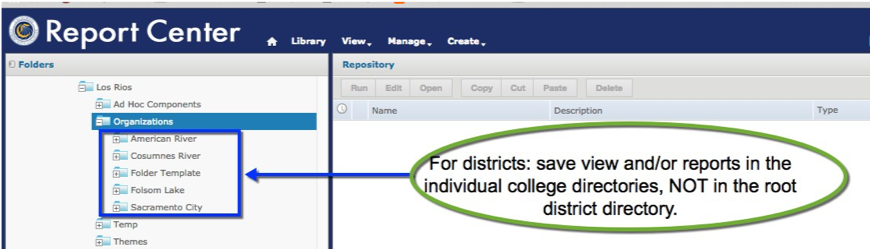
The College folder includes the Ad Hoc Components, Organizations, and Themes subfolders. You can create subfolders in the College folder to contain any Public reports and their associated Views that you copy for customization, as well as any Ad Hoc reports that you create from scratch.
Note: For districts, when you copy a View and/or a report into your College folder, you need to copy it into the specific college directory. You cannot save View and/or reports in the root district directory.
Customizing Reports
Customizing a Public Report
Some Public reports provide the option to customize the results displayed. You can change the displayed results by removing data, but you cannot add data. For example, in the New Applicant Detail Report, the report includes options to alter the Columns and Group displayed, as well as Filter controls to the right of the report.
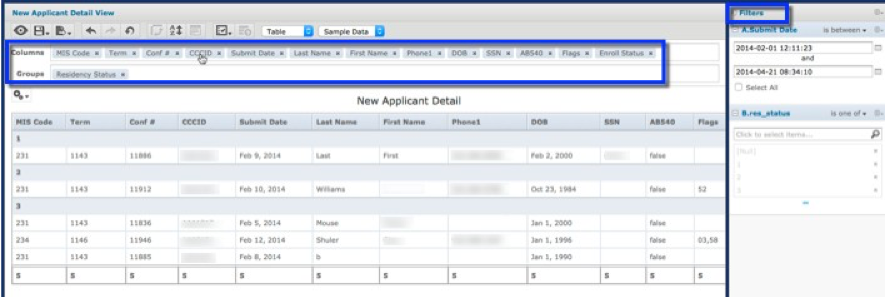
You can quickly alter the details displayed by clicking the "x" icon for each of the columns to remove that particular column from the report results. For example, after removing some of the columns, the report might look like the example image below.
If you want to alter a Public report by adding data to it, you must copy the Public report's corresponding View into your college folder where you can modify it and then create a report from it.
Use the following steps to copy and then customize a Public report view:
In the Public folder, navigate to the "View Folder" that contains the View you want to change.
Copy the View in one of two ways: using the Copy button or the Save As drop-down list option. To Copy the View:
Select the View by clicking the square to the left of the view name. This will make the Copy button on the top of the list active.
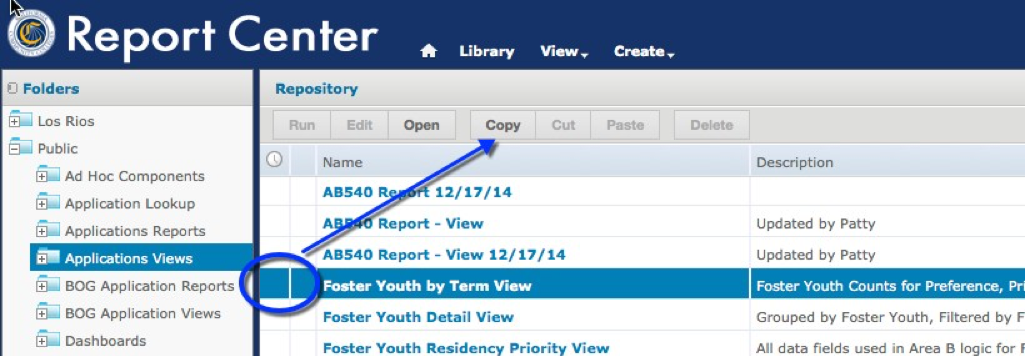
Click Copy.
Navigate to the folder where you store the views for your college and click the Paste button.
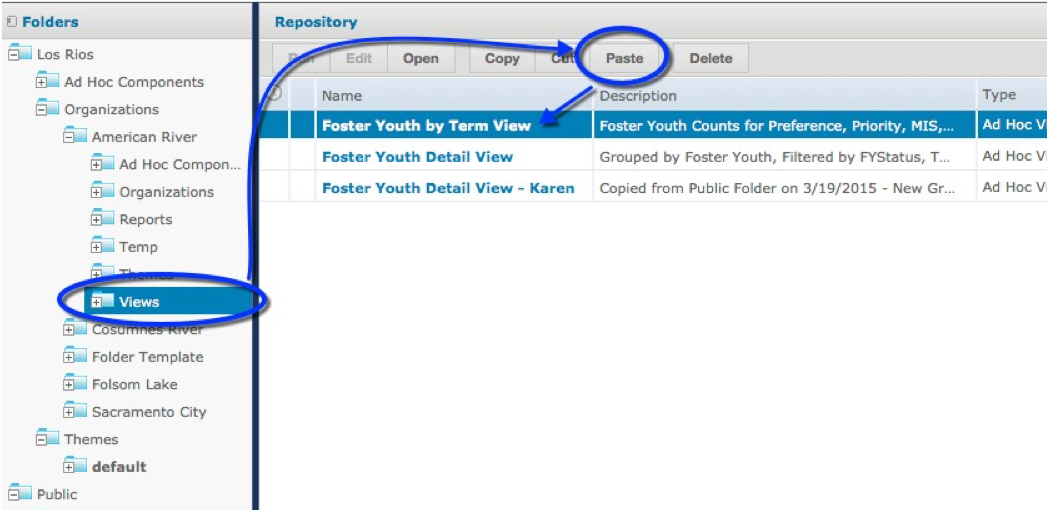
You now have a copy of the View which you can modify and save as an "Ad Hoc" report.
-OR-To copy the View using Save As:
Click the View name link to open it in the Ad Hoc editor view.
Click the Save icon and select the Save Ad Hoc View As... option.
[ INSERT IMAGE(S) ]
When the Save As dialog box opens, navigate to the college folder (or, as in the example below, navigate to the college folder in your district), enter a revised name in the Data View Name (required): field, enter any revised text in the Data View Description field, and click Save.
[ INSERT IMAGE(S) ]
Open the View you just copied in the college folder so that it displays in the Ad Hoc editor with a list of Fields options from which you can choose from on the left side of the window.
[ INSERT IMAGE(S) ]
Click and drag any fields you want to add from the Fields options to the Columns or Rows fields in the Ad Hoc editor view.
In the Ad Hoc editor view, click the "x" icon for any fields that you want to remove from the View. From here you can use the Ad Hoc editor controls to further customize the view.
When you are done updating the View, click the Save icon again and select the option to Save Ad Hoc View and Create Report from the drop-down list to display the Save Ad Hoc View and Create Report dialog box.
[ INSERT IMAGE(S) ]
Select the Reports folder for your college and click the Save button to save the report. The View the report is based on remains saved in the View folder for the college.
Creating Ad Hoc Views and Reports
[ INSERT IMAGE(S) ]
Creating a New Ad Hoc View and Report
You can create your own custom Ad Hoc reports most easily by copying one of the standard Views from the Public folder and pasting it into your College View folder.
You can also create your own View from scratch. To create your own Ad Hoc View from scratch, you'll first create the View, and then save the report from it. Once a report is created, it can be run immediately, run in background, scheduled, or included on a dashboard. Dashboards provide the ability to have more than one report on the same web page. Reports on a dashboard can have the same or different filter criteria.
Important note: Any change you want to make to a report must be first made to its associated View, either by editing the View, or copying the View and then editing it.
To create an Ad Hoc View, use the follow steps:
Select Create -> Ad Hoc View from the CCC Report Center menu bar, or, from the Home page, click the Create link from the Ad Hoc Views resource option to open the Data Chooser dialog box.
[ INSERT IMAGE(S) ]
Click to open the Topics subfolders and then click to select from one of the options: BOG Fee Waiver, Schools, Submitted Applications, or xap_applications. The Table, Chart, and Crosstab buttons become enabled.
Click to select Table, Chart, or Crosstab and automatically display a blank New Ad Hoc View. Three panels display along with a Tool Bar.
[ INSERT IMAGE(S) ]
The Data Source Selectionpanel (left) displays data fields available based on the data source (topic or ) you selected. The fields are organized in categories. Click the + to open a field category. You can use the Data Dictionary for the CCCApply application (Standard or International) or BOG Fee Waiver on which you are reporting for more information on each field's details.
The Ad Hoc View panel (center) is where you build your view by clicking and dragging items from the Data Selection panel and Measures options onto the canvas. Other tools you can use here include the Ad Hoc Editor Tool bar, the Layout Band (columns and rows fields), and the Canvas Options selector (gears) icon.
The Filters panel (right) displays any fields you select to be used as filters and allows you to refine the definition of those filters.
Tip: For filters based on date fields, you can configure a "relative date filter" that refreshes data to a specified date range by using key words and a number. For example, if you want to run a report that displays student data that is only from the previous week, you would set a filter that looks like this: "WEEK-1". For details, see the online help's "Using Filters" topic.
See the "Working with the Ad Hoc Editor" help topic in the online Help for further information.
Scheduling Reports
You can schedule a report to run at a specific date and time, including a recurring time frame (every Friday at 9 am. for example). The image below is an example of how you begin this process. When you right-click a report Name, a pop-up menu displays and you can click the Schedule... option to open a Scheduled Jobs window that allows you to configure your scheduled report.
The online help includes detailed information on scheduling a report under the help topic "Scheduling Reports" (within the "Running Reports and the Report Viewer" topic).