...
The Enabling Services team strives to build strong, customer-centric relationships with colleges throughout the implementation process with the following support representatives:
Enabling Services Team Member | Supporting Role |
|---|---|
College |
Experience Managers ( |
CEM) | Serve as your first point-of-contact for all things related to CCCTC products and services, including scheduling a demo. |
Product Implementation Readiness (IPM) | Works with the |
CEMs and the implementation engineers (ICE) to ensure your implementation project says on track. | |
Implementation & Configuration Engineers (ICE) | Provides hands-on implementation setup and configuration support to prepare your college to go live with CCCTC products and services. |
College Support Services Representatives (SUP) | Provides post-implementation support for CCCTC products and services. |
Get Started with Implementation: Contact yourCollege Relationship Experience Manager (CRMCEM) to discuss new products and upgrades at cems@ccctechcenter.org.
...
Navigate to the CCCApply Report Center using the custom URL configured exclusively for your college (based on your college or district MIS code). Each college is provided two unique URLs for your branded version of the CCCApply Report Center; one for the CCCApply Pilot environment, and one for the CCCApply Production environment.
At the login screen, enter your college system credentials for the username and password (the credentials used to authenticate you and your college or district IdP.
Click the Sign In button.
...
To view and save the report in other formats, click the Export button.
Select an export format from the drop-down. The export options are listed in “Export File Types” list below.
Option | Format Name | Usage |
Adobe Acrobat | Choose a report template based on report size. Use the Actual Size report template for reports with dimensions less than or equal to 14400px by 14400px. See Report Templates for more information. | |
Excel (Paginated) | XLS | Not recommended for exporting most tables or crosstabs. Repeats headers and footers on each page. |
Excel | XLS | Ignores page size and produces spreadsheet-like output. |
CSV | Comma Separated Values | Characters outside the Latin 1 character set can cause the Excel spreadsheet to look unacceptable. Try saving the file and importing it using Excel's Import functionality. |
DOCX | Word | Do not export reports having more than 63 columns. In Microsoft Word, you cannot create tables having more than 63 columns. |
RTF | Rich Text Format | Creates a large output file and, therefore, takes longer to export than PDF, for example. |
ODT | OpenDocument Text | For best results, minimize the number of rows and columns and make sure they don’t overlap. |
ODS | OpenDocument Spreadsheet | Same as ODT. |
XLSX (Paginated) | Microsoft Open XML Format Spreadsheet | Not recommended for exporting most tables or crosstabs. Repeats headers and footers on each page. |
XLSX | Microsoft Open XML Format Spreadsheet | Ignores page size and produces spreadsheet-like output. |
PPTX | Microsoft PowerPoint Presentation | Each page of report becomes a slide in the PowerPoint presentation. |
Save the report in the export file format, for example PDF, or open the report in the application.
...
Click the Public folder to expand it and display the sub-folders that contain standard reports.
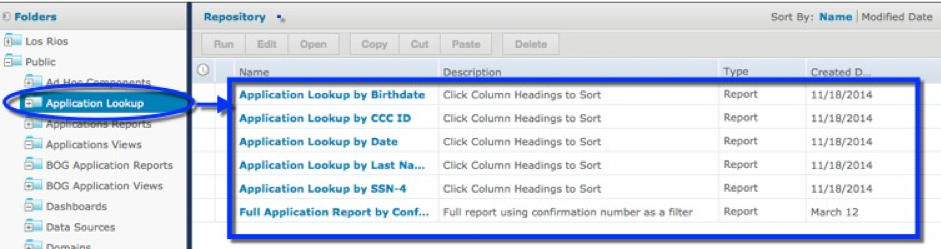

Click the subfolder name to display the report options for that report type in the Repository list.
Click the report Name link in the Repository list to run the report.
If the report you selected prompts you for input (such as the Lookup reports), then you will need to click the OK button to close the Input Controls dialog box that displays prior to running the report.
You can then save the report or export the report into a variety of file formats.
...
Click the View name link to open it in the Ad Hoc editor view.
Click the Save icon and select the Save Ad Hoc View As... option.
| Warning |
|---|
[ INSERT IMAGE(S) ] |
When the Save As dialog box opens, navigate to the college folder (or, as in the example below, navigate to the college folder in your district), enter a revised name in the Data View Name (required): field, enter any revised text in the Data View Description field, and click Save.
...
Open the View you just copied in the college folder so that it displays in the Ad Hoc editor with a list of Fields options from which you can choose from on the left side of the window.
...
Click and drag any fields you want to add from the Fields options to the Columns or Rows fields in the Ad Hoc editor view.
In the Ad Hoc editor view, click the "x" icon for any fields that you want to remove from the View. From here you can use the Ad Hoc editor controls to further customize the view.
When you are done updating the View, click the Save icon again and select the option to Save Ad Hoc View and Create Report from the drop-down list to display the Save Ad Hoc View and Create Report dialog box.
...
...
[ INSERT IMAGE(S) ]
Select the Reports folder for your college and click the Save button to save the report. The View the report is based on remains saved in the View folder for the college.
Creating Ad Hoc Views and Reports
...
Select Create -> Ad Hoc View from the CCCApply Report Center menu bar, or, from the Home page, click the Create link from the Ad Hoc Views resource option to open the Data Chooser dialog box.
Click to open the Topics subfolders and then click to select from one of the options: BOG Fee Waiver, Schools, Submitted Applications, or xap_applications. The Table, Chart, and Crosstab buttons become enabled.
Click to select Table, Chart, or Crosstab and automatically display a blank New Ad Hoc View. Three panels display along with a Tool Bar.
The Data Source Selection panel (left) displays data fields available based on the data source (topic or ) you selected. The fields are organized in categories. Click the + to open a field category. You can use the Data Dictionary for the CCCApply application (Standard or International) or BOG Fee Waiver on which you are reporting for more information on each field's details.
The Ad Hoc View panel (center) is where you build your view by clicking and dragging items from the Data Selection panel and Measures options onto the canvas. Other tools you can use here include the Ad Hoc Editor Tool bar, the Layout Band (columns and rows fields), and the Canvas Options selector (gears) icon.
The Filters panel (right) displays any fields you select to be used as filters and allows you to refine the definition of those filters.
...
| Panel | ||||||
|---|---|---|---|---|---|---|
| ||||||
Tip: For filters based on date fields, you can configure a "relative date filter" that refreshes data to a specified date range by using key words and a number. For example, if you want to run a report that displays student data that is only from the previous week, you would set a filter that looks like this: "WEEK-1". For details, see the online help's "Using Filters" topic. |
...
To arrange the sorting precedence of the fields, select each field in the Sort window and click Move to top, Move up, Move down, or Move to bottom: , , , and . |
To remove a field, select it and click the icon icon. |
Click OK. The table updates to display the rows sorted by the selected fields.
...