Version 6.0.1 - Last version update: 12-15-2021
| Tippanel | ||||||
|---|---|---|---|---|---|---|
| ||||||
This user guide is intended provided for authorized CCC college staff users of the CCCApply admission applications and the CC Promise Grant application. |
...
The Enabling Services team strives to build strong, customer-centric relationships with colleges throughout the implementation process with the following support representatives:
Enabling Services Team Member | Supporting Role |
|---|---|
College Relationship Management (CRM) | Serve as your first point-of-contact for all things related to CCCTC products and services, including scheduling a demo. |
Product Implementation Readiness (IPM) | Works with the CRMs and the implementation engineers (ICE) to ensure your implementation project says on track. |
Implementation & Configuration Engineers (ICE) | Provides hands-on implementation setup and configuration support to prepare your college to go live with CCCTC products and services. |
College Support Services Representatives (SUP) | Provides post-implementation support for CCCTC products and services. |
Get Started with Implementation: Contact yourCollege Relationship Manager (CRM) to discuss new products and upgrades at crms@ccctechcenter.org.
...
Note: The OpenCCCApply Pilot environment is meant to be a carbon copy of the Production environment to allow colleges to stage changes in their configurations and test implementations prior to an update or product roll-out. While the Pilot environment is a clone of Production, it is not actively monitored for errors and issues in the same way that the Production environment is. Thus, there is no support team in place to respond to Pilot environment issues. For those colleges currently implementing OpenCCCApply, reporting issues to your project team may not be effective.
Our recommendation is that college staff personnel use the CCCTechnology.info support site to communicate issues, ask questions, and request assistance. CCCTC support staff review incoming posts and endeavor to respond within 48 hours to issues posted about the Pilot environment. Depending on the nature of the issue, resolution time will vary; however the intent is to provide updates on progress towards implementation every 24 hours.
Logging In
Navigate to the CCCApply Report Center using the custom URL configured exclusively for your college (based on your college or district MIS code). Each college is provided two unique URLs for your branded version of the CCCApply Report Center; one for the CCCApply Pilot environment, and one for the CCCApply Production environment.
At the login screen, enter your college system credentials for the username and password (the credentials used to authenticate you and your college or district IdP.
Click the Sign In button.
...
Authorized User Access
The User Manager module allows authorized users from each college or district MIS code to view, add, edit, and delete* all other users within the scope of their own authorized user permissions. The User Manager section provides the ability for users with authorized role(s) to create new users and permissions for your college or district.
...
If you are a designated “Add User” for your college, you are permitted to manage users for your MIS code. Use the following steps to add users to the CCCApply Report Center (these steps are also documented in the CCCApply Administrator User Guide):
Log in to the CCC Administrator (CAP).
From the CCC Administrator home page, select “System Administrator” from the “Applications” menu dropdown.
Select User Manager from the System Administrator sub-menu to view the User Manager summary table. All users authorized to access CCCApply and related applications within your permissions scope (your MIS code and the applications you are authorized to access) will display, including your own user account. ((Applications->System Administrator->User Manager))
Click the “Add/Edit User” button to display the add user modal.
Select Data Use Only from the Authorization Type drop-down list to assign the new user the ability to use CCCApply Report Center reporting functionality. OR, select Add User Authority from the Authorization Type drop-down list to assign the new user the ability to use CCCApply Report Center reporting functionality AND the ability to add other CCCApply Report Center users.
Select your college's MIS code from the Authorized MIS Code drop-down list. If you are setting up a user for a District instead of an individual college, then you will select the District MIS code. District MIS codes end in '0'. District-level users can access and report on data for all the colleges in the district.
Note: The CCCApply Report Center is configured for single-sign on, which means that the user ID and password you use to access your college accounts are the same as those you use to log in to the CCCApply Report Center.
...
Library link
View -> Repository link
Search bar
Access Point | Description |
|---|---|
The Library Link | The Library link displays a list of all available reports and their corresponding Views. By default, the list is sorted ascending by Name. To sort the list by the date each report was last modified, click the Modified Date link (which toggles to display Name as the active link). |
The View > Repository Link | Clicking the View link displays drop-down list options of Search Results, Repository, and Messages. When you select Repository, the available reports display in two categories: your college(Los Rios in the example image below), and Public. |
The Search bar | Entering a search value in the Search bar returns reports in the Repository view that match the search criteria. |
The Library
...
The Repository
...
To open a report in the Report Viewer:
Locate your report in the library or repository.
Click the report name, or right-click the report name and select Run. In the repository, you can also click the report row and select Run from the tool bar. The report opens in the Report Viewer.
Running or Creating a Report
...
Running an instance of an existing report
Creating a new report from an existing Ad Hoc view
To run a report:
Log into the CCCApply Report Center with your authorized user account.
On the Home page, click the large icon in the Reports block.
The search results appear, listing your own college resources and all the public resources that your user account has permission to access.
...
Exporting the Report
To export the report:
To view and save the report in other formats, click the Export button.
Select an export format from the drop-down. The export options are listed in “Export File Types” list below.
Option | Format Name | Usage |
Adobe Acrobat | Choose a report template based on report size. Use the Actual Size report template for reports with dimensions less than or equal to 14400px by 14400px. See Report Templates for more information. | |
Excel (Paginated) | XLS | Not recommended for exporting most tables or crosstabs. Repeats headers and footers on each page. |
Excel | XLS | Ignores page size and produces spreadsheet-like output. |
CSV | Comma Separated Values | Characters outside the Latin 1 character set can cause the Excel spreadsheet to look unacceptable. Try saving the file and importing it using Excel's Import functionality. |
DOCX | Word | Do not export reports having more than 63 columns. In Microsoft Word, you cannot create tables having more than 63 columns. |
RTF | Rich Text Format | Creates a large output file and, therefore, takes longer to export than PDF, for example. |
ODT | OpenDocument Text | For best results, minimize the number of rows and columns and make sure they don’t overlap. |
ODS | OpenDocument Spreadsheet | Same as ODT. |
XLSX (Paginated) | Microsoft Open XML Format Spreadsheet | Not recommended for exporting most tables or crosstabs. Repeats headers and footers on each page. |
XLSX | Microsoft Open XML Format Spreadsheet | Ignores page size and produces spreadsheet-like output. |
PPTX | Microsoft PowerPoint Presentation | Each page of report becomes a slide in the PowerPoint presentation. |
Save the report in the export file format, for example PDF, or open the report in the application.
...
To create a report from the Home page:
On the Home page, click Create in the Reports block. The Create Report wizard opens.
Select the Ad Hoc view you want to use as the basis for your report.
Select a report template. To use a template other than the default, select Custom Report Template, click Browse and select the desired template.
Click OK. If asked, enter data in the filters (input controls) as needed.
You can now begin working with your report.
...
To customize your column formatting:
Run your report, so it opens in the Report Viewer.
Click the header in the column you want to format.
Hover over and click Formatting...
Click the Basic Formatting tab, and change the following options if needed:
Apply to – Select the part of the column you want to apply the formatting to.
Heading text – Type new heading text to replace the current text
Font – Scroll through the menu to select a font.
Size – Scroll through the menu to select a font size.
Style – Click to select Bold, Italic, or Underlined text.
Background Color – Click to open the background color picker, then click to select the background color.
Font Color – Click to open the font color picker, then click to select the text color.
Alignment – Click to select Left, Center, or Right alignment.
If needed, click Previous Column or Next Column to change the formatting for an adjacent column.
Click OK.
Running a Report with Input Controls or Filters
...
Follow these steps to run a Public report:
Click the Public folder to expand it and display the sub-folders that contain standard reports.
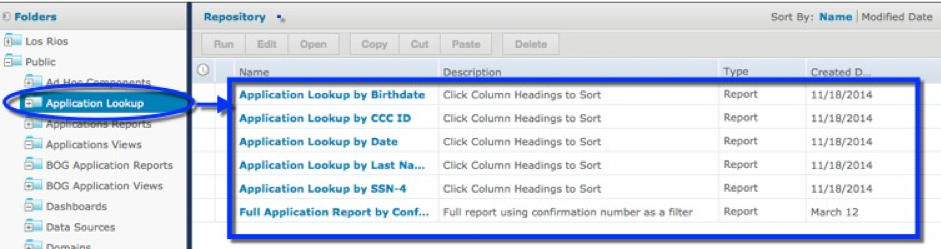
Click the subfolder name to display the report options for that report type in the Repository list.
Click the report Name link in the Repository list to run the report.
If the report you selected prompts you for input (such as the Lookup reports), then you will need to click the OK button to close the Input Controls dialog box that displays prior to running the report.
You can then save the report or export the report into a variety of file formats.
Note: When you run a report that prompts you to enter a date and time, even if you do not need to use time as a measure for your results, you must enter at least 1 second in the time field in order for the report to return results properly.
...
Use the following steps to copy and then customize a Public report view:
In the Public folder, navigate to the "View Folder" that contains the View you want to change.
Copy the View in one of two ways: using the Copy button or the Save As drop-down list option. To Copy the View:
Select the View by clicking the square to the left of the view name. This will make the Copy button on the top of the list active.
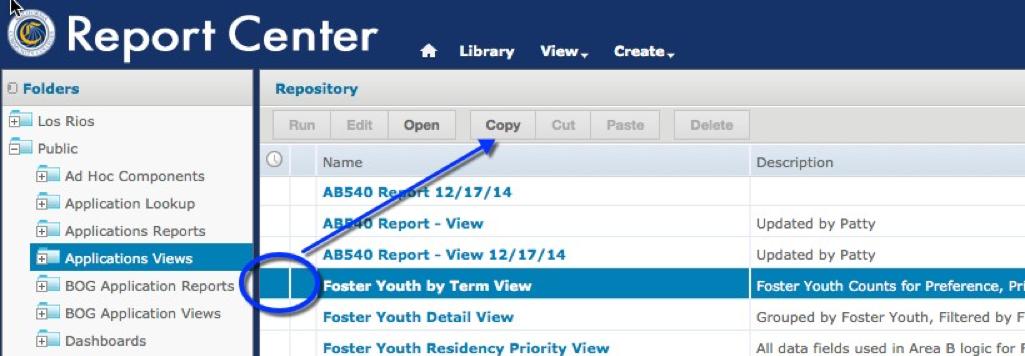
Click Copy.
Navigate to the folder where you store the views for your college and click the Paste button.
...
You now have a copy of the View which you can modify and save as an "Ad Hoc" report.
-OR-To copy the View using Save As:
Click the View name link to open it in the Ad Hoc editor view.
Click the Save icon and select the Save Ad Hoc View As... option.
| Warning |
|---|
[ INSERT IMAGE(S) ] |
When the Save As dialog box opens, navigate to the college folder (or, as in the example below, navigate to the college folder in your district), enter a revised name in the Data View Name (required): field, enter any revised text in the Data View Description field, and click Save.
| Warning |
|---|
[ INSERT IMAGE(S) ] |
Open the View you just copied in the college folder so that it displays in the Ad Hoc editor with a list of Fields options from which you can choose from on the left side of the window.
| Warning |
|---|
[ INSERT IMAGE(S) ] |
Click and drag any fields you want to add from the Fields options to the Columns or Rows fields in the Ad Hoc editor view.
In the Ad Hoc editor view, click the "x" icon for any fields that you want to remove from the View. From here you can use the Ad Hoc editor controls to further customize the view.
When you are done updating the View, click the Save icon again and select the option to Save Ad Hoc View and Create Report from the drop-down list to display the Save Ad Hoc View and Create Report dialog box.
| Warning |
|---|
[ INSERT IMAGE(S) ] |
Select the Reports folder for your college and click the Save button to save the report. The View the report is based on remains saved in the View folder for the college.
Creating Ad Hoc Views and Reports
...
To create an Ad Hoc View, use the follow steps:
Select Create -> Ad Hoc View from the CCCApply Report Center menu bar, or, from the Home page, click the Create link from the Ad Hoc Views resource option to open the Data Chooser dialog box.
Click to open the Topics subfolders and then click to select from one of the options: BOG Fee Waiver, Schools, Submitted Applications, or xap_applications. The Table, Chart, and Crosstab buttons become enabled.
Click to select Table, Chart, or Crosstab and automatically display a blank New Ad Hoc View. Three panels display along with a Tool Bar.
The Data Source Selection panel (left) displays data fields available based on the data source (topic or ) you selected. The fields are organized in categories. Click the + to open a field category. You can use the Data Dictionary for the CCCApply application (Standard or International) or BOG Fee Waiver on which you are reporting for more information on each field's details.
The Ad Hoc View panel (center) is where you build your view by clicking and dragging items from the Data Selection panel and Measures options onto the canvas. Other tools you can use here include the Ad Hoc Editor Tool bar, the Layout Band (columns and rows fields), and the Canvas Options selector (gears) icon.
The Filters panel (right) displays any fields you select to be used as filters and allows you to refine the definition of those filters.
| Tip |
|---|
Tip: For filters based on date fields, you can configure a "relative date filter" that refreshes data to a specified date range by using key words and a number. For example, if you want to run a report that displays student data that is only from the previous week, you would set a filter that looks like this: "WEEK-1". For details, see the online help's "Using Filters" topic. |
...
To add fields and measures as columns to a table:
In the Data Source Selection panel, click to select the field or measure you want to add to the table. Use Ctrl-click to select multiple items.
Drag the selected item into the Columns box in the Layout Band. (The field is added to the view as a column in the table.)
To remove a field or measure from a table:
...
Data is grouped in the table according to the order in which the data groups have been added. You can change the order by dragging the groups into position if needed.
To create a group:
In the Data Source Selection panel, click to select the field you want to add to the table as a group.
Drag the field to the Groups box in the Layout Band. (The Ad Hoc view refreshes and displays the data grouped under a new header row.)
You can also add a group to the table by right-clicking a field and selecting Add as Group.
...
To edit a column or header label:
On the Ad Hoc view panel, right-click the column or group header you want to rename.
Select Edit Label from the context menu. The Edit Label window opens.
In the text entry box, delete the existing name and enter the new name.
Click Submit.
If space is at a premium, you can remove labels from the view. When you delete a label, it still appears when you look at the view in the Ad Hoc Editor, but does not appear when you run the report.
...
To delete a column or header label:
On the Ad Hoc view, right-click the column or header label you want to remove.
Select Delete Label from the context menu.
To re-apply a label:
Right-click the column or header label you want to replace.
Select Add Label from the context menu. The Edit Label window opens.
Enter the label name, if needed.
Click Submit.
Managing Column Size and Spacing
You can change the size of, and spaces between, columns to manage the appearance of your table or use space more efficiently.
To resize a column:
In the Ad Hoc View panel, click to select the column you want to resize.
Move the cursor to the right edge of the column.
When the cursor changes to the resize icon, click and drag the column edge right or left until the column is the needed size.
Spacers can be added to a table to arrange columns farther apart, or add margins to a table.
To change the spacing between columns:
In the Data Source Selection panel, in the Measures section, click Spacer.
Drag the spacer into the Columns box in the Layout Band between names of the two columns you want to move apart.
A spacer column, labeled, appears in the table. Repeat this action to add space as needed between columns.
To remove a spacer, right-click the spacer column and select Remove from Table.
To use spacers to create table margins:
In the Data Source Selection panel, click to select Spacer.
Drag the spacer into the Columns box in the Layout Band.
Repeat until the margins are as wide as needed.
Repeat the steps above, adding the spacer to the right edge of the table.
Reordering Columns
You can move columns to the right or left to reorder data in your table.
To reorder a column:
In the Ad Hoc View panel, right-click the column you want to move.
Select Move Right or Move Left from the context menu.
Sorting Tables
In the Ad Hoc Editor, you can sort the rows of a table by any field, using a number of different methods.
To sort a table:
Click the A-Z sort icon. The Sort window appears. If the table is already sorted, the window shows the fields used.
To add a field to sort on, double-click the field in Available Fields. The Available Fields panel now lists only fields not currently in Sort On.
Select one or more fields to sort by. You can also use Ctrl-click to select multiple fields.
To arrange the sorting precedence of the fields, select each field in the Sort window and click Move to top, Move up, Move down, or Move to bottom: , , , and . |
To remove a field, select it and click the icon . |
Click OK. The table updates to display the rows sorted by the selected fields.
...
Right-click a field in the Fields section of the Data Source Selection panel, and select Use for Sorting from the context menu. In this case, the table is sorted by a field that isn’t in the table; you may want to note the sorting fields in the title.
Right-click a column header on the Canvas of the Ad Hoc View panel, and select Use for Sorting from the context menu.
If a column is already being used and you want to stop using it or change the sorting, right-click the column and select Change Sorting from the context menu.
Adding a Title
Above the table, click the text Click to add a title.
Enter the new table title in the text entry box.
Changing the Data Format
You can change the formatting for columns containing numeric data, such as dates and monetary amounts. The format is applied to all rows as well as the group- and view-level summaries. By default, non-integer fields use the -1,234.56 data format; integers use -1234.
To change the data format for a column:
In the Ad Hoc view, right-click the column header.
Select Change Data Format from the context menu.
Select the format you want to use. These options vary, depending on the type of numeric data contained in the column.
The data in the column now appears in the new format.
...
To change the table’s data source:
At the top of the Data Source Selection panel, click and select Change Source.
Select a different Topic, Domain, or OLAP connection.
Click Table to apply the new data source.
Click Cancel to return to the editor without changing the Topic.
...