...
For the purposes of this "Quick Start" guide, it is assumed you are accessing reports by clicking View -> Repository to view the Public and college reports.
...
...
Reports
...
Understanding Reports & Views
...
& The Report Viewer
The CCC Report Center makes it easy to run reports. When you run a report, it opens in the interactive Report Viewer. With the Viewer, you can personalize and refine the displayed report data. If the report has filers (input controls), you run the report with one set of data and then another.
The Report Viewer
The Report Viewer allows you to view a report, export content to various output formats, and apply formatting, sorting, and filters to control how the data is displayed.
To open a report in the Report Viewer:
Locate your report in the library or repository.
Click the report name, or right-click the report name and select Run. In the repository, you can also click the report row and select Run from the tool bar. The report opens in the Report Viewer.
Running or Creating a Report
You can view and work on a report in the Report Viewer in a number of ways:
Running an instance of an existing report
Creating a new report from an existing Ad Hoc view
To run a report:
Log into the CCC Report Center with your authorized user account.
On the Home page, click the large icon in the Reports block.
The search results appear, listing your own college resources and all the public resources that your user account has permission to access.
...
If you are running a report with multiple pages, the first page of the report appears before the entire report is loaded. You can begin scrolling through report pages as they load, as indicated in the pagination controls in the upper left corner of the Report Viewer. If you want to cancel loading the report before it is complete, click the Cancel Loading button that appears next to the pagination controls.
| Note |
|---|
IMPORTANT: Table reports are limited to display a maximum of 20k rows. To ensure your report has fewer than the maximum rows allowed, add one or more filters (Input Controls) into your Ad Hoc View design. |
Table & Crosstab Reports
A table report is a simple, tabular report that lists application data.
Creating a Report
You can create a custom report directly from the Report Center Home page. This method allows you to select an existing Ad Hoc view and generate a report from it, without going through the Ad Hoc Editor.
To create a report from the Home page:
On the Home page, click Create in the Reports block. The Create Report wizard opens.
Select the Ad Hoc view you want to use as the basis for your report.
Select a report template. To use a template other than the default, select Custom Report Template, click Browse and select the desired template.
Click OK. If asked, enter data in the filters (input controls) as needed.
You can now begin working with your report.
The report shown below was created using the Ad Hoc Editor. As this type of report runs, you can interact with it in the Report Viewer to visualize the data in different ways. Column formatting allows you to highlight certain columns and fields, and filtering and sorting report output on‑the‑fly can provide timely views of the data that answer your questions. For example, suppose you’re running the New Applicants public template report and want to know how many applicants have a permanent address outside of California. Highlighting the State column with red text and filtering it to show only the states that are not “CA” would reveal this data.
Formatting a Report
Column Formatting
You can customize the basic format of column headings and fields, using the Format Column dialog. Hover over and click Formatting... The Format column dialog appears.
...
Format Column Dialog
You can alter a column’s basic formatting or apply conditional formatting to a column.
| Info |
|---|
In longer reports, columns have floating headers. If your report extends past your browser frame, use the vertical scroll bar to move up and down the list. If you do not see a vertical scroll bar, try increasing the width of your browser window. |
This section discusses how to apply formatting to column headings and values.
Column formatting options include:
Text
Font type, size, and style
Background color
Font color
Text alignment
To customize your column formatting:
Run your report, so it opens in the Report Viewer.
Click the header in the column you want to format.
Hover over and click Formatting...
Click the Basic Formatting tab, and change the following options if needed:
Apply to – Select the part of the column you want to apply the formatting to.
Heading text – Type new heading text to replace the current text
Font – Scroll through the menu to select a font.
Size – Scroll through the menu to select a font size.
Style – Click to select Bold, Italic, or Underlined text.
Background Color – Click to open the background color picker, then click to select the background color.
Font Color – Click to open the font color picker, then click to select the text color.
Alignment – Click to select Left, Center, or Right alignment.
If needed, click Previous Column or Next Column to change the formatting for an adjacent column.
Click OK.
Understanding Reports & Views
In order to create a report you must first create a View, and then create a report from it. A Report View is a kind of "report designer" that defines the type of report and the format, layout, data, groupings, and filters to be applied when the report is generated.
...
Click the Public folder to expand it and display the sub-folders that contain standard reports.

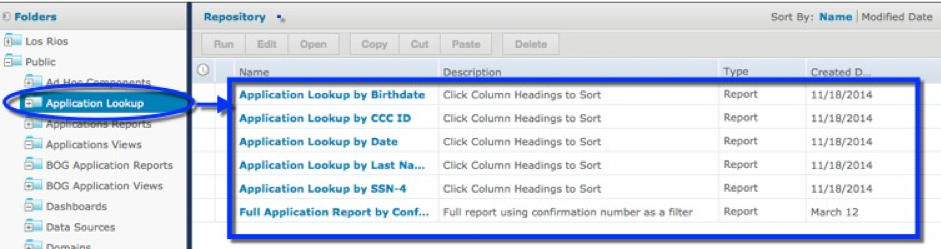
Click the subfolder name to display the report options for that report type in the Repository list.
Click the report Name link in the Repository list to run the report.
If the report you selected prompts you for input (such as the Lookup reports), then you will need to click the OK button to close the Input Controls dialog box that displays prior to running the report.
You can then save the report or export the report into a variety of file formats.
...
In the Public folder, navigate to the "View Folder" that contains the View you want to change.
Copy the View in one of two ways: using the Copy button or the Save As drop-down list option. To Copy the View:
Select the View by clicking the square to the left of the view name. This will make the Copy button on the top of the list active.

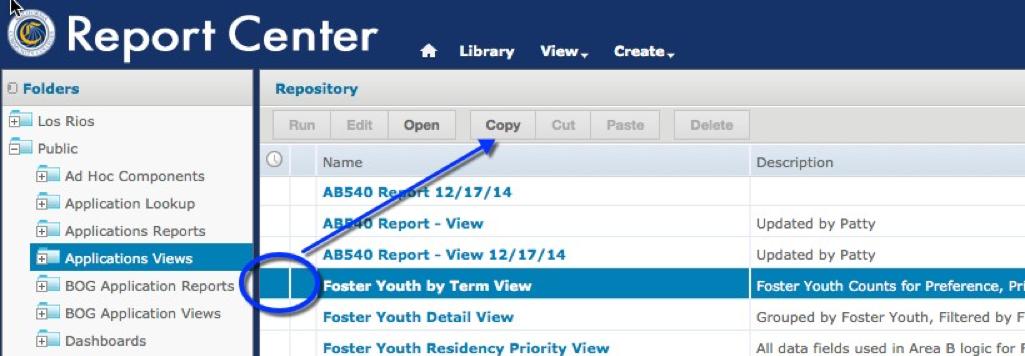
Click Copy.
Navigate to the folder where you store the views for your college and click the Paste button.
...