| Info |
|---|
CCC Data Warehouse Report Server v7.8 Last Update: Feb 2022 |
...
Authenticator for Mac and Windows Chrome browsers is available free from the Chrome Web Store. This app installs very quickly to your desktop (recommended) as well as your phone, and includes a lot of great features that promote security and usability. NOTE: The entire download and install process takes less than one minute. You may need local IT authorization and assistance to install it if policy requires this.
To Install the Chrome Authenticator:
...
To run a report, click the name of a report in the repository. For example, click DW LGBTQ Report. The report appears in the Report Viewer.
...
On the Home page, click Create in the Reports block. The Create Report wizard opens.
Select the Ad Hoc view you want to use as the basis for your report.
Select a report template. To use a template other than the default, select Custom Report Template, click Browse and select the desired template. See Report Templates for more information.
Click OK. If asked, enter the input controls needed. See Using Input Controls.
You can now begin working with your report.
...
| Info |
|---|
Creating Filters with Relative DatesYou can filter information in your view based on a date range relative to the current system date. You can accomplish this using date-based filters, and entering a text expression describing the relative date or date span you want to display, using the format <Keyword>+/-<Number> where:
For example, if you want to see all of the CC Promise Grant Applications submitted during the prior week, your expression would be: WEEK-1. |
...
| Tip |
|---|
Optional: To change the report format type of the Ad Hoc View and eventually your Report template, follow the steps below. |
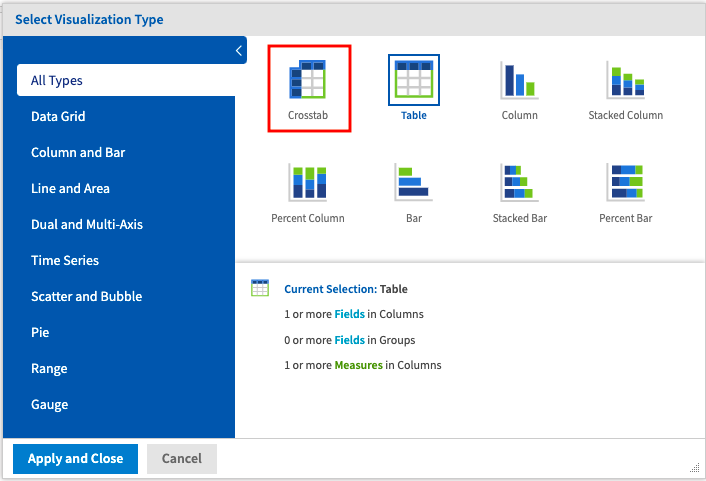
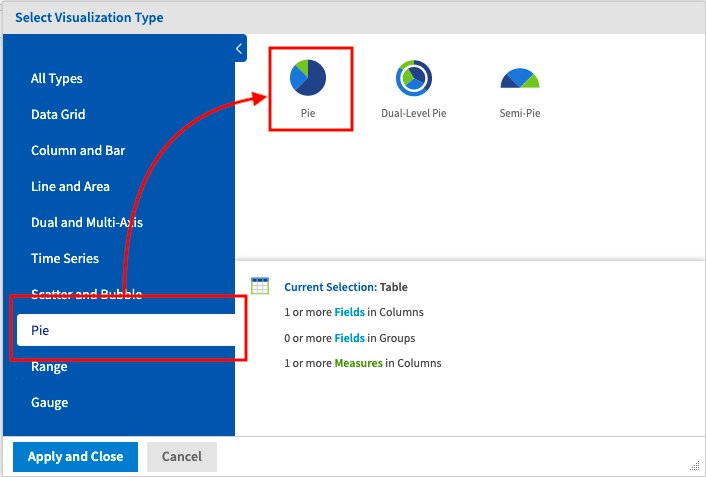
To change the format of your custom reportthe Ad Hoc View, click the Select Visualization Type icon in the Ad Hoc Editor toolbar to display the Select Visualization Type dialog box. | To create a Crosstab type report View/Report, click on the Crosstab icon, then click the Apply and Close button at the bottom of the dialog box. | To create a pie chart type report View/Report, click the Pie link in the left menu, then select your preferred pie icon. Then click the Apply and Close button at the bottom of the dialog box. |
 |  |
...
| Tip |
|---|
Optional: To add or remove data fields in your custom report… |

...
Option:
to your custom Ad Hoc View, follow the process below. |
To add or remove |
...
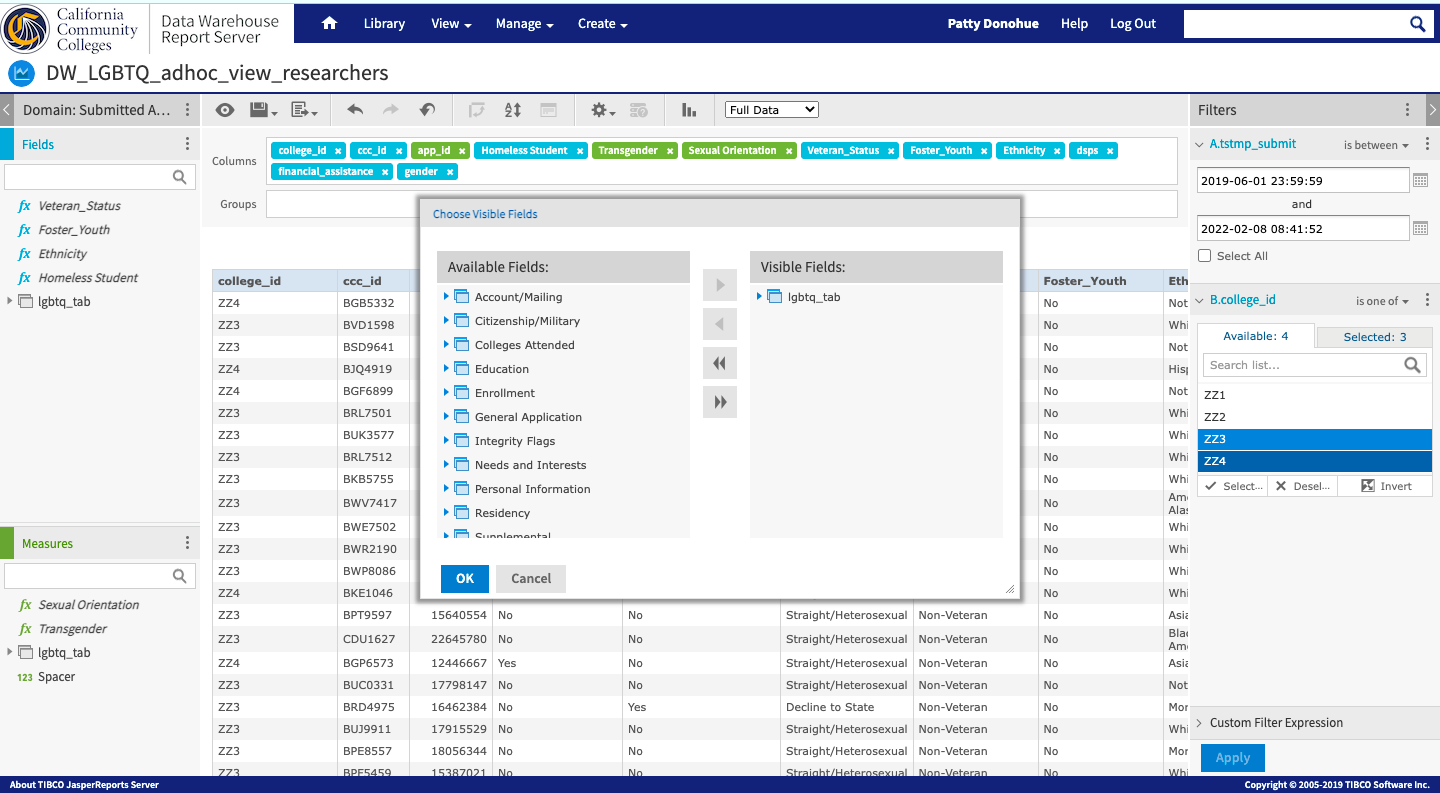
data fields from the same data source… With your Ad Hoc View open, click on the three vertical dots in the Data Selection column and select Choose Visible Fields from the menu. | Select fields to bring into your Ad Hoc View… |
 |  |
With the Choose Visible Fields dialog box displayed, select fields from the Available Fields column that you want to use in your report. In the screenshot below, one new field - “birthdate” - is selected from the Personal Information folder. | Click the single right arrow to bring selected fields over to the Visible Fields column, or click the double right arrows to bring all data fields over (not shown here). See below that the “birthdate” field is now in the Visible Fields column. |
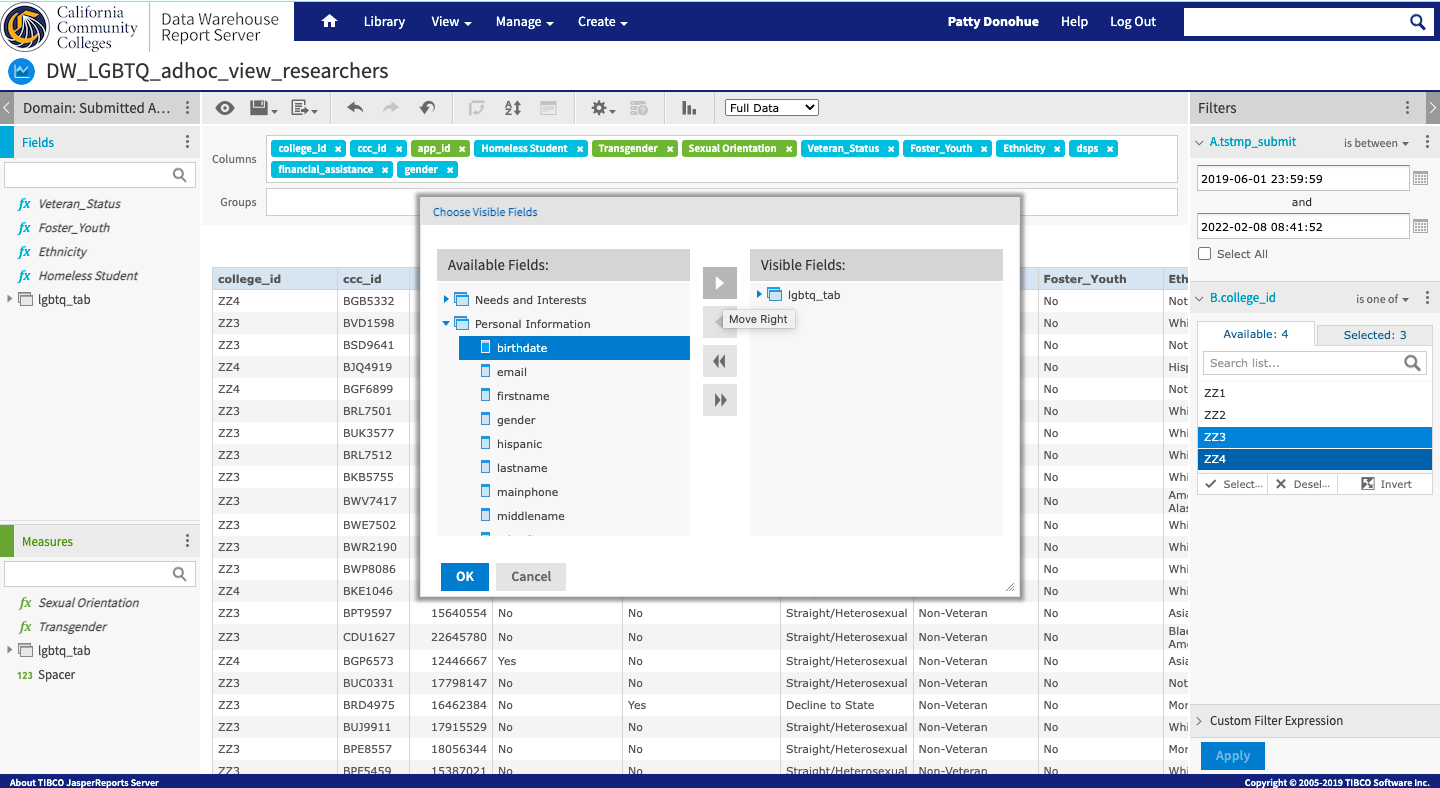 | 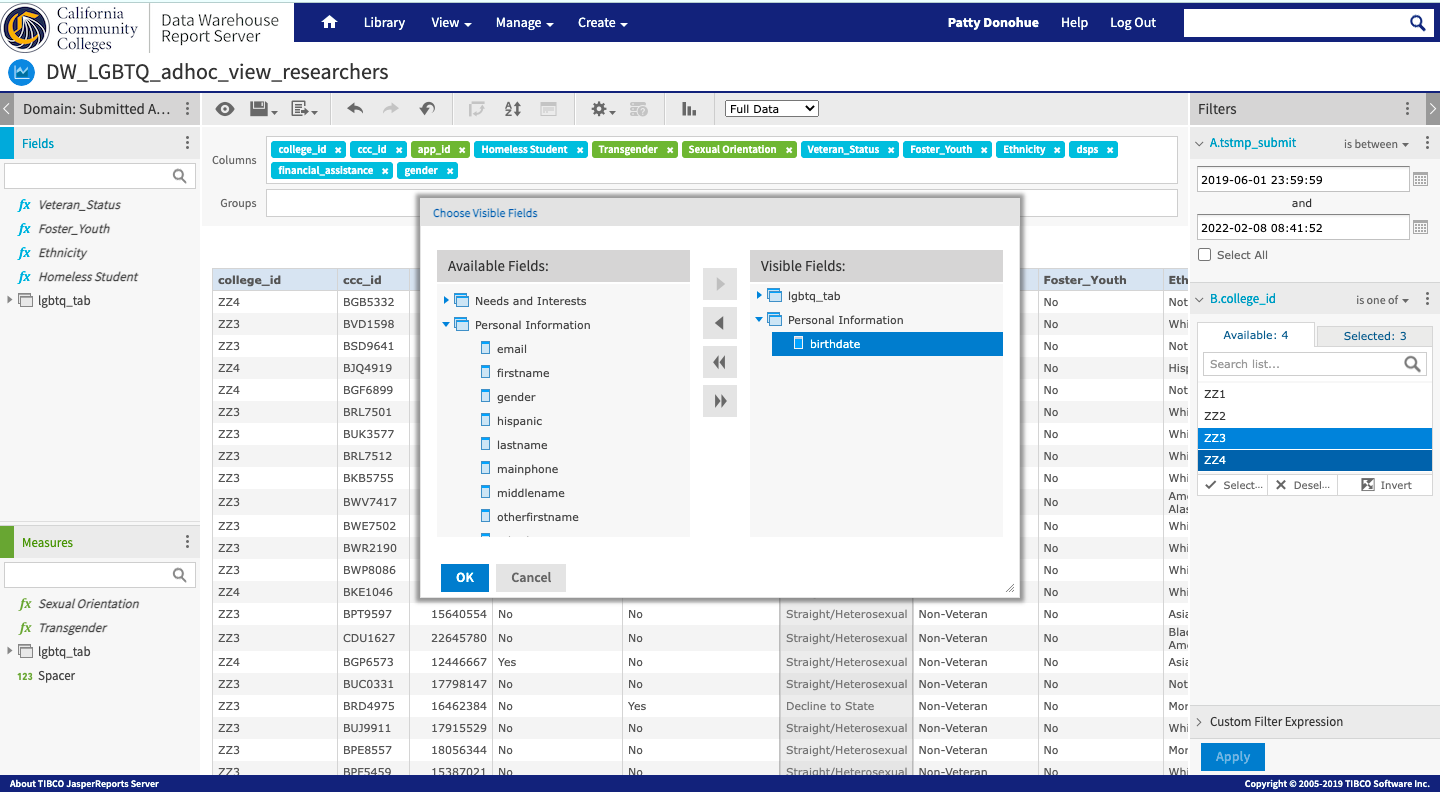 |
Once you’ve selected the fields you want to be visible in the Ad Hoc Editor - which can be used as data field columns, measures, groups, and/or input control filters, click OK. In the example above, you will now see “birthdate” as an available data field in the Fields column and can be used in your report.
| Tip |
|---|
Optional: To add or remove Input Controls (filters) in your Ad Hoc View, do this… |
 | |
| Tip |
|---|
Option: To add a Group to your table report, do this… |
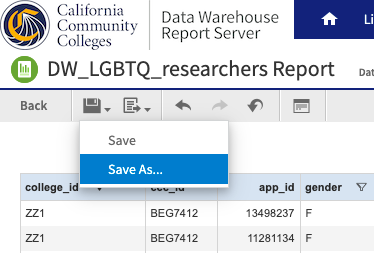
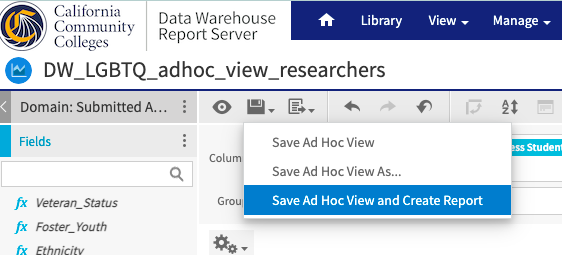
Step 4: Save your changes using the Save As > Save Ad Hoc View and Create Report function.
Step 14A: Click the Save icon in the Ad Hoc Editor tool bar. | Step 24B: In the dropdown menu, select Save Ad Hoc View and Create Report to open the Save As dialog menu. | Step 34C: In the Save Ad Hoc View and Create Report dialog box, enter the names of your View and Report, and designate the folders where each will be saved. |
 |  |
...