| Panel | ||||||
|---|---|---|---|---|---|---|
| ||||||
CCC Data Warehouse Report Server v7.8 Last Update: June 2022 |
In This User Guide
| Table of Contents | ||||
|---|---|---|---|---|
|
Part 1: Overview
The information provided in this document serves as a "Quick Start" guide for the CCC Data Warehouse Report Server (“DW Report Server”). With the DW Report Server you can:
Run preconfigured reports that pull data from the CCC Data Warehouse, currently limited to the LGBTQ report.
Query available data sources, run ad-hoc reports, and download results.
Create an Ad Hoc View from which you can create Reports based on the following data sources:
CCCApply Standard & Noncredit Applications
CCCApply LGBTQ Data (AB 620)
CCCApply International Application
California Colleges Promise Grant Application
Multiple Measures Placement Service (MMPS)
COCI - Chancellor’s Office Curriculum Inventory
C-ID - Course Identification System
| Panel | ||||||||
|---|---|---|---|---|---|---|---|---|
| ||||||||
Note: If you are interested in direct (ODBC/JDBC) access to the CCC Data Warehouse via a site-to-site VPN, please contact your Enabling Services College Relationship Manager (CRM) to initiate the request for this access. |
| Note |
|---|
Access to Canvas Data is currently only available by direct access connection. For information regarding the Canvas DW Direct Connect service, please contact your Enabling Services College Relationship Manager (CRM) to initiate the request for this access. |
About the Data Warehouse Report Server
The DW Report Server is a secure, user-friendly reporting tool that creates pixel-perfect reports, charts & dashboards using secure CCC Data Warehouse data.
The CCC Data Warehouse is a structured source of master data that can be used to generate the data marts and reports and analytics that end-users need.
The DW Report Server is powered by Jasper Reports, a Java-based open-source reporting tool. Jasper Reports, connected to the CCC Data Warehouse, allows for advanced reporting usage and provides extensive help that you can access from the Help link.
| Panel | ||
|---|---|---|
| ||
About TIBCO JasperReports Server |
User Authorization & Authentication
The new Data Warehouse Report Server (CCC Data release v.2.1) requires an authorized user account with two-factor authentication to ensure the privacy and security of the Data Warehouse Report Server.
Requesting Access to the Report Server
College and District Institutional Researchers: The identified lead IRPE Researcher at each college or district will be established as the authorized user and “gatekeeper” for their organization (organized by MIS Code) upon confirmation from their college or district Vice President. These “gatekeepers” can then request access for additional researchers at their organization by submitting an email request to ES Support Services or contacting their College Relationship Manager (CRM) with the information below.below.
| Panel | ||||||
|---|---|---|---|---|---|---|
| ||||||
Process for Gatekeepers to Request Additional Users |
Chancellors Office & Other External Stakeholders:All requests for access to the Data Warehouse Report Server from the Chancellors Office or other external stakeholder, are to be directed to Mark Cohen, Product Manager, CCC Data,mcohen@ccctechcenter.orgwho will obtain approval from the Vice Chancellor for Digital Innovation & Infrastructure at the CCC Chancellor’s Office.
Support & FAQs
Support is available to authorized Report Server users in our 24/7 online support community CCCTechnology.info - where college and district staff can share ideas, ask questions, and report bugs and issues for all the CCC Technology Center online applications.
Our experienced support engineers monitor all incoming posts and comments, Monday - Friday, 7:00am - 4:00pm PST. Depending on the nature of the issue or comment, support engineers will respond within 24 hours to critical issues regarding production applications.
...
Part 2: User Account Setup & Login Process
This part of the User Guide provides information about:
TheReport Server User Account
The Report Server User Account that uses Keycloak directly (CO/CVC/Superadmins)is designed with two-factor authentication (2FA) to secure and protect our college and systemwide student data. Two-Factor Authentication is a security system that authenticates a user’s identity by requiring two or more pieces of evidence (credentials + verification code) before granting access to a service or system. School and District users will use the school’s IDP to log in. The school’s login may include 2FA, but this 2FA is not managed by the CCCTC.
| Note |
|---|
IMPORTANT: Beginning with the production launch of DW Report Server (CCC Data v.2.1), all new and existing authorized DW Report Server users are required to set up new user accounts with two-factor authorization in order to gain access to data through the DW Report Server. All previous accounts have been de-provisioned and removed. For more information, please contact your Enabling Services College Relationship Manager (CRM) or contact Support Services. |
User Types & Access Levels
Authorized access corresponds directly to the user’s college or district 3-digit MIS Code, as shown in the table below.
User Type | Authorized Access Level |
College User | Single college access to available data sets based on College MIS Code |
District User | Multi-college access to available data sets based on District MIS Code |
Chancellor's Office User | Access to all data sets across all colleges |
The Account Creation & User Setup Process
The account creation and user setup process is a two-part workflow between a CCCTC system Administrator and the authorized user. There are two user types and each has its own process for setting up the user in Keycloak. Once the user is set up in Keycloak and the user authenticates via either a Keycloak log-in page (branded with CCTC logos) or via the IDP’s log-in page (branded for the individual school or district). Below is a breakdown of each of the two ways of setting up a user.
...
The User engages with the Enabling Services implementation team and receives acknowledgment that the user has been created with the appropriate roles and attributes
The User goes to the appropriate link for their IDP and logs in
The User is automatically authenticated and authorized to log in to the DW Report Server.
Receiving Your Secure Login Credentials (CO/CVC/Superadmin)
For security purposes, the User will receive their account credentials and password (for CO/CVC/Superadmins) from the CCCTC Administrator in one or two separate emails to their institution email address (.edu).
...
| Note |
|---|
Note: The unique password will not be passed to the authorized user until they have commenced the implementation process with the CCCTC Enabling Services team for added security. |
Implementing the Authentication Software (CO/CVC/Superadmin)
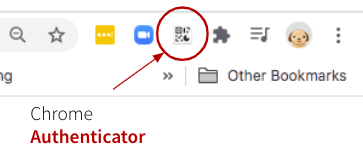
Before the Keycloak nativeuser (CO/CVC/Superadmin)can log in to the Report Server for the first time, they must have a compatible authentication app installed that implements Time-based One-Time Password TOTP functionality such as Google Authenticator, Chrome Authenticator, or Authy(which you could download to a phone or computer). There are many free, user-friendly Authenticator apps available at no cost that can be downloaded and installed quickly and easily onto your desktop and/or mobile device.
| Tip |
|---|
Suggestion: Although any six-digit TOTP compatible authentication software should work for the Report Server User Account, the tools that we’ve found to be most user friendly are: Chrome Authenticator for desktop use and Google Authenticator for mobile devices. Both are free downloads and both can also be used together. |
Chrome Authenticator for Desktop
Authenticator for Mac and Windows Chrome browsers is available free from the Chrome Web Store. This app installs very quickly to your desktop (recommended) as well as your phone, and includes a lot of great features that promote security and usability. NOTE: The entire download and install process takes less than one minute. You may need local IT authorization and assistance to install it if policy requires this.
To Install the Chrome Authenticator:
Navigate to the Chrome Web Store and search for Authenticator by authenicator.cc
Click on “Add to Chrome” button to initiate the download and follow very simple instructions to install.
When the Authenticator app has been installed, a shortcut will appear in your Extensions toolbar in your browser.
| Note |
|---|
WARNING: If you have already installed Chrome Authenticator (Authenticator.cc) don’t re-install this application as it will overwrite you previous download of this same application. |
NEXT: Start the “First-Time User Login” process below to initiate the authentication process and login.
Google Authenticator App for Mobile Device
Another user-friendly option, especially for users who want to use their mobile device for authentication, is the Google Authenticator; a free app available from the Google Play Store.
...
NOTE: The authenticator tools recommended above are just suggestions. If the user already has a compatible authentication tool it may be used instead.
The First-Time User LogIn Process
The first time a new Keycloak nativeuser (CO/CVC/Superadmin) logs into the Data Warehouse Report Server they need to establish the connection between their account credentials, a shared secret key (QR Code) and the authentication softwarein order enable the multi-factor login authentication. This is a one time process that is completed in the steps below.
...
The user has the Data Warehouse Report Server URL (http://dw-reports.ccctechcenter.org/)
The user has received their unique password and account credentials from the CCCTC Administrator
The user has installed and configured a compatible authentication application on their desktop and/or mobile device
Step 1: Enter Your Account Credentials on the Log In Page
Ensure you have one of the compatible authenticator apps installed on your desktop or mobile device.
Navigate to theData Warehouse Report Server URL(http://dw-reports.ccctechcenter.org/) and land on the Log In page.
Enter the account credentials provided to you into the following fields:
User ID: Enter your institutional email address in the User ID field (.edu or .org is required).
Password: Enter the unique password provided to you by the Administrator (sent separately via Privnote). This password is generated by the system Administrator during the account creation process. This unique password cannot be changed or reset by the user.
...
| Note |
|---|
Forgot Your Password? The unique password configured by the Administrator for the user account cannot be changed or reset by the user. If you’ve forgotten your account password - or if your account has been compromised and you need a replacement password, please contact ES Staff Support to request assistance at staffsupportccctc@openccc.zendesk.com. |
Step 2: Scan the QR Code Page
The Scan the QR Code page is displayed once during the “first-time user login” process. The user must have the authentication software installed on their desktop or mobile device in order to scan the QR code that appears on the page. The code is captured by the authenticator app which establishes the connection between the account (shared secret key hidden in the barcode) and the authenticator app to complete the initial two-factor authentication process.
With your Authenticator App installed, scan the QR code that appears in the center of the page.
Scanning the QR Code with Chrome Authenticator (from desktop).
Scanning the QR Code with Google Authenticator(usinga mobile device).
As the authenticator scans the barcode (QR Code), a six-digit verification code will appear/register in your authenticator app.
As soon as you see the six-digit code appear in your authenticator app, copy the code and then click “Login” to go to the next page.
Click the “Login” button to return to the Log In Page.
...
NOTE: This step requires the user to use theirauthentication app - previously installed on their desktop or mobile device - to scan the onscreen barcode. The “secret” key identified by the barcode will add the required attribute to the User’s account.
Using Chrome Authenticator to Scan the QR Code
Once the Chrome Authenticator app has been installed, a shortcut will appear in your Extensions toolbar in your browser.
Click the Authenticator icon in your Extensions toolbar to open the tool.
Click the scan icon and move your mouse over the QR barcode in the center of the page.
Click + hold the mouse to drag the scan functional across the bar code.
The secret key hidden within the barcode will register as a six digit code in the Authenticator registered to your Report Server account.
...
Using Google Authenticator to Scan the QR Code
Once the Google Authenticator app has been installed on your mobile device, an icon will appear on your phone wall or homepage.
Click to open the Google Authenticator app
Point the camera on your mobile device at the barcode on the screen and snap a picture.
The secret key hidden within the barcode will register as a six digit code in the GA app registered to your DW Report Server account.
| Tip |
|---|
Tip: After scanning the QR code and confirming the verification code is captured by the authentication software, snap a screen shot of the code and store in a secure place. For security purposes, don’t store the verification code with the URL or other credentials to the DWRS. |
Step 3: Repeat Log In Page
After scanning and capturing the six-digit verification code in authenticator app, you have established the connection between the authenticator application and your secure Report Server User Account.
Now you must return to the Log In page to re-enter your user credentials and verification code.
Back on the Log In page, re-enter your account credentials in the input fields: Organization (MIS Code), User ID (email address), and Password.
Click the “Login” button, again.
...
| Warning |
|---|
Validation Error Note: A validation error message will display to all users when they are completing the first-time user login” process. This system message is indicating that the user attempted to login without entering a verification code. As you know, you haven’t been asked for a verification code yet (that is coming in Step 4). Please disregard this error message and continue with the login process. |
Step 4: Verification Code Page
After re-entering the account credentials a second time, the user is now presented with the Verification Code page to enter the six-digit verification code that was scanned and stored in the Authenticator app. .
Enter your six digit Verification Code
Click on your Authenticator app and retrieve the time-limited verification code.
Paste the code in the “Verification Code” field.
Click the “Login” button on the Verification Code page to complete the login process.
...
Verified User Login Process
The “first-time login” process is a one-time process. Once the new user has completed the first-time login process, they do not have to repeat steps 2 - 4 UNLESS they need to re-install their authentication software and generate a new QR code.
After the first time login and verification process, user login requires the user to enter their credentials and the verification code retrieved from the authenticator app.
...
Step 1: Log in Page
Navigate to the Report Server URL (http://dw-reports.ccctechcenter.org/) and land on the Log In page.
Enter your account credentials and password in the input fields.
Organization (MIS Code): Enter your 3-digit MIS Code.
User ID: Enter your institutional email address in the User ID field (.edu, or org) (Required)
Password: Enter your unique password.
...
Step 2: Verification Code Page
The User refers to their authenticator app to retrieve their new Verification code within 30 seconds of making the request (clicking on Login button on Log In screen).
Verification Code: The user enters the code from the Authenticator App into the Verification Code field.
Click the “Login” button on the Verification Code page to complete the login process and access the DW Report Server.
| Note |
|---|
WARNING: Your unique Password is generated by the CCCTC Administrator at the time of account creation. The password cannot be changed or reset by the user. To get a new password, please contact ES Support Services. |
...
Part 3: Using the Report Server
The CCC Data Warehouse Report Server is a branded version of TIBCO JasperReports (v.7.8.0), with role-based access to integrated CCC Data data for authorized CCC researchers using multi-factor authentication.
| Panel | ||||||||
|---|---|---|---|---|---|---|---|---|
| ||||||||
Note: This scope of this User Guide encompasses details for accessing and running reports, views and dashboards related to CCC Data Warehouse data. For the purposes of this DW Report Server User Guide, it is assumed that you are accessing reports based on CCC Data Warehouse data specifically. |
In this section:
...
| Panel | ||||||
|---|---|---|---|---|---|---|
| ||||||
What are the benefits of using the Report Server?
|
Introduction to the Report Server
The Getting Started Page
The first thing that displays when you sign in to the Report Server is the Getting Started (Home) page. From the Getting Started (Home) page, you can quickly access the most frequently used features of the server.
...
| Panel | ||||||
|---|---|---|---|---|---|---|
| ||||||
Note: The Getting Started image above may contain additional icons for features visible only to users with Administrator privileges. |
...
Getting Started Page Sections | Allows you to: |
Header bar Menu Items |
On the right side of the header bar, you can:
|
Getting Started Column |
|
Core Workflow Icons |
|
| Panel | ||||||||
|---|---|---|---|---|---|---|---|---|
| ||||||||
Note: It is expected that most |
...
DWRS users will use the Ad Hoc Views, Reports, and Dashboards resources. These basic topics are covered in this guide |
...
; however information related to other functionality is covered extensively in the JasperReports Server v7 online help documentation, which is accessible via the Help link in the top-right side of the header bar menu. |
The Library Page
The Library page offers a more focused view of the Repository objects. It displays only the data and resources that the user is authorized to view and work with.
...
All of these functions are available by right-clicking the item you want to work with and selecting an action from the context menu.
...
The Repository Page
The Repository is the server’s internal storage for folders, reports, analysis views, and related files. The Repository is organized as a structure of folders containing public and private resources and templates, as well as Organization folders, much like a file system.
...
List of resources in the Repository in a district organization's folder.
...
Repository Folders
The file system in the Repository has a tree structure which displays folders containing the resources that you have permission to view and access. Contents can be displayed by expanding the available folder icons in the Folders panel. There are two primary types of folders displayed to users: Public and Organization folders.
...
Repository: The Folder Panel tree showing various Organizations and Public folders.
Using Repository Resources
After finding a resource in the Repository, naturally you want to do something with it. Your options are:
...
You might also need permission to access the folder or dependent file, such as an image, of a resource. For example, to schedule a report, you need to have read/write/delete permission on the folder where server saves the report output. For more information about permissions, see the JasperReports Server Administrator Guide.
Searching the Repository
You can search the entire Repository, subject to your permissions, or narrow your search using filters. The Filters provided for searching the Repository restrict a search by name, who changed the resource, type of resource, date of the resource, and schedule.
To search the entire Repository, select View > Search Results from the header menu. The Search Results page appears with the Filters panel on the left side.
...
The Search Results Page
The Search Results page displays results of searches and filters.
...
Double-click a resource in the list to view it, or right-click a resource to see what functions are available from the context menu.
...
| Panel | ||||||
|---|---|---|---|---|---|---|
| ||||||
Helpful Hint: The server remembers your settings on the Search Results page, so the most commonly needed resources remain visible when you return to the page. |
...
Running Reports & The Report Viewer
The Report Server makes it easy to run reports. When you run a report, it opens in the interactive Report Viewer. With the Viewer, you can personalize and refine the displayed report data. If the report has input controls (filters), you run the report with one set of data and then another.
...
Overview of the Report Viewer
Running Reports
Formatting Options in a Table Report
Saving & Exporting a Report
| Tippanel | ||||||
|---|---|---|---|---|---|---|
| ||||||
Find more detailed information about Running Reports and the Report Viewer section of the JasperReports Server v7 User Guide. |
Overview of the Report Viewer
The Report Viewer allows you to view a report, export content to various output formats, and apply formatting, sorting, and filters to control how the data is displayed. This section describes the functions available in the Report Viewer.
Running a Report
To open and run a report in the Report Viewer:
Log in to the Data Warehouse Report Server.
Locate your report file in the Library or a folder in the Repository.
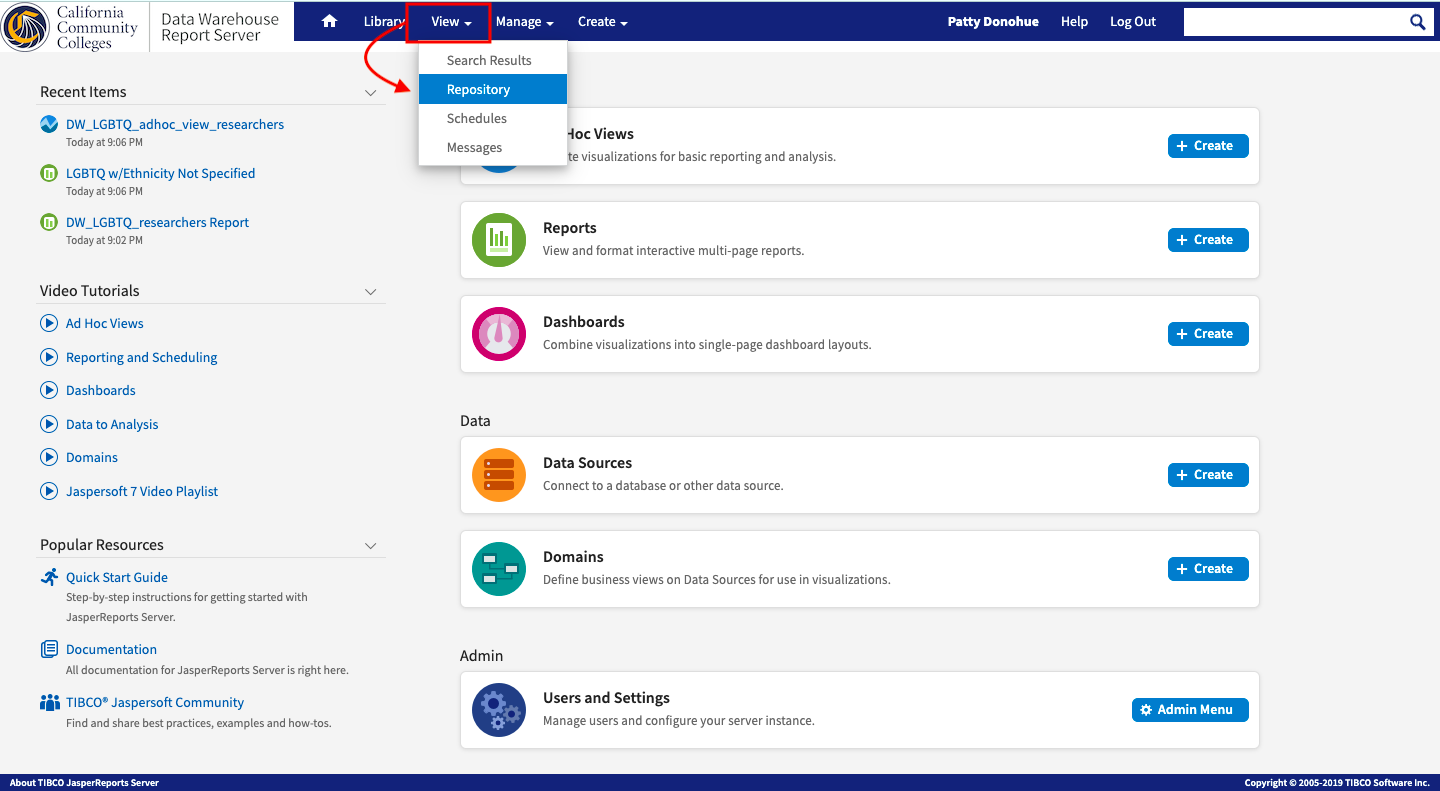
Repository: Click View > Repository from the main menu.
Library: Click Library link from the main menu.
Click the report name and then click the Run button in the tool bar. Alternately, right-click the report name and select Run from the menu.
The report will open in the Report Viewer.
...
| Warning |
|---|
IMPORTANT: There is a 200K row limit on all reports that are run. When building a Table report, ensure there is one or more filters configured to limit the report data to display under 200,000 rows. |
Running or Creating a Simple Report
You can view and work on a report in the Report Viewer in a number of ways:
Running an instance of an existing report
Creating a new report from an existing Ad Hoc view
Running a Simple Report
This section describes how to run a tabular report that lists account data.
To run a report:
Log into the Report Server with your authorized user account.
On the Home page, click View list in the Reports block.
The search results appear, listing your own files and other files that your user account has permission to view.
...
To run a report, click the name of a report in the repository. For example, click DW LGBTQ Report. The report appears in the Report Viewer.
...
Output of the DW LGBTQ Report.
| Panel | ||||||
|---|---|---|---|---|---|---|
| ||||||
NOTE: If you are running a report with multiple pages, the first page of the report appears before the entire report is loaded. You can begin scrolling through report pages as they load, as indicated in the pagination controls in the upper left corner of the Report Viewer. If you want to cancel loading the report before it is complete, click the Cancel Loading button that appears next to the pagination controls. |
Creating a Report
You can create a report directly from the Report Server Home page. This method allows you to select an existing Ad Hoc view and generate a report from it, without going through the Ad Hoc Editor.
To create a report from the Home page:
On the Home page, click Create in the Reports block. The Create Report wizard opens.
Select the Ad Hoc view you want to use as the basis for your report.
Select a report template. To use a template other than the default, select Custom Report Template, click Browse and select the desired template. See Report Templates for more information.
Click OK. If asked, enter the input controls needed. See Using Input Controls.
You can now begin working with your report.
Report Templates
When you create a report, the Create Report wizard displays layout options for generating and exporting the report:
...
Most commonly, you will choose Default Report Template.
Using Report Templates for PDF
If you are exporting your report to PDF, choose your option based on the size of the output.
For most PDF exports, you can use Actual Size, which supports a maximum size of 14400px by 14400px.
For reports with an output height exceeding 14400 px, use a paginated report template that is wide enough for your report. For example, if you have a long report with width less than 842px, you can use the paginated A4 Landscape theme.
Reports with output width exceeding 14400 px will be truncated in PDF. Redesign your report or use a different export format.
Navigating a Report
If your report has multiple pages, you can use the pagination controls to move through the report quickly.
...
Use at the top of the Report Viewer to navigate to the previous page.
Use to navigate to the next page.
Use to go to the end of the report.
Use to go to the beginning of the report.
If you know the number of the page you want to view, enter the page number in the Current Page indicator box.
Formatting Options in a Table Report
Reports that contain table components are enabled for user interactivity. Table components are defined in Jaspersoft Studio or from Ad Hoc Views. When a table is enabled for interactivity, column formatting, filtering, and sorting are managed from a menu displayed by clicking the column you want to apply changes to.
...
To use column formatting, click on the column heading to display the icons described above.
...
icons described above.
...
| Panel | ||||||
|---|---|---|---|---|---|---|
| ||||||
Add Column Filters to Your Report: To add an additional filter to a report after it’s run, click the column heading header of the data you want to filter and select the funnel icon. |
...
To restrict the data that appears in your report, a column filter can be applied limiting the results displayed based on the data type.
To add a column filter:
Click the column heading of the data you want to filter and select the filter (funnel) icon from the context menu.
The Filter Column dialog box appears.
Select the “Show only rows where…” radio button and select the appropriate operator from the menu list.
Click OK to see your report results based on the applied filter.
...
To remove the column filter:
Repeat the actions to add a column filter, until the Filter Column dialog box appears.
Click the “Show all rows” radio button.
Click OK.
Saving & Exporting a Report
You can save a report or export a report in a variety of file formats, including PDF, Excel, CSV, DOCX, RTF, XLS, and more.
...
Below is a screen image of a report exported in PDF format.
...
| Panel | ||||||
|---|---|---|---|---|---|---|
| ||||||
After running and/or exporting a report, click View → Repository to return to the Repository screen to view the list of college and public reports. |
| Panel | ||||||
|---|---|---|---|---|---|---|
| ||||||
Dependent ReportsWhen you create a report from an Ad Hoc view, the report is considered “dependent” on that view. When you save an Ad Hoc view, some, but not all, of its changes appear in its dependent reports. For example, if you open an Ad Hoc view with a table and adjust the data level for its columns, the column changes will show up in previous reports created from that view. In cases where changes to an Ad Hoc view could cause errors in dependent reports, you should save the updated view with a different file name and create a new report. |
Running a Report with Input Controls or Filters
Some reports will display automatically in the Report Viewer, while others may prompt you for input parameters to refine your report results first via the Input Controls dialog box.
...
To avoid this, save a version of the report with your selected data preloaded. That way, when subsequent reports are run from the same source, they will not overwrite your report.
Simple Input Controls
Using input controls, you run a report with one set of data and then another. When saved, an instance of the report with alternate input controls is called a Report Version, and is labeled as such in the repository.
Multi-Select Input Controls
A single report can be created and run with multiple different input controls, allowing for a greater level of data granularity.
Saving Input Control Values
Selected input control values can be saved and used at another time. Both the original report and a copy of it can be saved. The Report Server saves a version of the report with the selected values as a child of the original report. This new version of the report appears as a child of the original report in the repository,
| Panel | ||||||
|---|---|---|---|---|---|---|
| ||||||
More information about using Input Controls and Filters is available in the TIBCO JasperReports Online Help: Running a Report With Input Controls or Filters |
Scheduling Reports
You can schedule a report to run at a specific date and time, including a recurring time frame (every Friday at 9 am. for example). The image below is an example of how you begin this process.
...
When you right-click a report Name, a pop-up menu displays and you can click the Schedule... option to open a Scheduled Jobs window that allows you to configure your scheduled report.
...
| Tippanel | ||||||
|---|---|---|---|---|---|---|
| ||||||
See the online help topic under the Reports workflow View tutorial link. At around the 3:35 mark the tutorial begins to demonstrate scheduling a report. |
...
Part 4: Creating Custom Ad Hoc Views & Reports
This section explains the process of creating ad hoc Views and custom reports using CCC Data Warehouse data.
| Panel | |
|---|---|
| |
| |
Understanding Ad Hoc “Views”A report View is a kind of "report designer" that defines the data source, type of report, and the fields, groups and filters that will be applied when the report is generated. Every report is first created (designed) as an ad hoc View in the Ad Hoc Editor, and then saved as a report. Once an ad hoc View is created and saved as a report, it can be:
|
Working with the Ad Hoc Editor
The Ad Hoc Editor is the interactive designer for creating and editing an ad hoc View, where you can explore and analyze data from a topic, domain, or other data source. Ad hoc Views are used to create content for various types of Reports, including tables, crosstabs, and charts. After you create an ad hoc View, you - and any other authorized users with the proper permissions - can save it as a Report, then further refine the displayed information and personalize the look of the report in the Report Viewer.
Getting to the Ad Hoc Editor
The Ad Hoc Editor is the interactive design interface used for creating and editing Ad Hoc Views. There are two ways to access the Ad Hoc Editor:
Select Create > Ad Hoc View from the main menu.
Open an existing Ad Hoc View.
Either of these actions will launch the Ad Hoc Editor.
Layout Panels
The Ad Hoc Editor contains the following panels, from left to right:
...
The image above shows the Ad Hoc Editor user interface and the data fields, filters, and groups selected for a table report format.
| Panel | ||||||
|---|---|---|---|---|---|---|
| ||||||
The Ad Hoc Editor provides analysis options (such as slice, pivot, and filter) to help you recognize trends and outliers in your data. You can drill into specific details or analyze your data at a very high level. |
| Note |
|---|
Reminder: In order to create a report you must first create an ad hoc report View and save it as a report. |
The Data Source Selection Panel
The Data Source Selection panel (left column) contains the folders of available fields in the Topic or Domain chosen by the user to build the report. If you are using a Domain, fields may appear in nested sets. Available data fields may be divided into two sections in the panel, Fields and Measures. You can use the search field in each section to locate a specific field or measure.
...
To hide this panel, click < in the top left corner; this is helpful when arranging content in a large Ad Hoc view. Click the same icon on the minimized panel to expand it.
The Ad Hoc View Panel
The Ad Hoc View panel (center column) is where your custom report View structure displays as you drag data source items into the Columns and Rows fields. Other tools you can use here include the Ad Hoc Editor Tool bar, the Layout Band (columns and rows fields), and the Canvas Options selector (gears) icon.
...
The Filters Panel
The Filters panel (right column) displays any fields you select to be used as filters of your report data, and allows you to refine the definition of those filters.
...
When a filter is added to a new ad hoc View, the Filters panel will display (right column) and the user has options to set the input controls for that filter. The operator can be specified for each filter, based on the type of data field.
...
on the type of data field.
...
| Panel | ||||||
|---|---|---|---|---|---|---|
| ||||||
NOTE: For filters based on date fields, you can configure a "relative date filter" that refreshes data to a specified date range by using key words and a number. For example, if you want to run a report that displays student data that is only from the previous week, you would set a filter that looks like this: "WEEK-1". For details, see the online help's "Using Filters" topic. |
| Tippanel | ||||||
|---|---|---|---|---|---|---|
| ||||||
Tip: See the View tutorial link for the Ad Hoc Views workflow on the Report Server's Home page to access a video with further details. |
Ad Hoc Sources: Topics & Domains
The following repository objects provide a prepared connection to a data source for Ad Hoc view creation:
...
You can also open and edit an existing Ad Hoc view to create a new Ad Hoc view.
Ad Hoc View Types
The design and content tasks for creating a new report are determined by the Ad Hoc View Type that is selected. By default, all new ad hoc Views are set to the Crosstab format type.
...
| Note |
|---|
By default, all new ad hoc Views are set to the standard Crosstab type. To create a Table report, you must change the format type to Table in the “Select Visualization Type” dialog box. |
| Panel | ||||||
|---|---|---|---|---|---|---|
| ||||||
Note: This document only covers the Table type in detail. For more discussion on crosstab and chart type formats, see JasperReports Server v7 User Guide: Working with Standard Crosstabs. |
Changing the Ad Hoc View Type
The format of your ad hoc View type can be changed at any time while in the Ad Hoc Editor.
Steps to change from a Crosstab to a Table format:
Click the chart icon in the tool bar in the Ad Hoc Editor to display the “Select Visualization Type” dialog box.
Click on the Table icon - or your preferred type - to highlight your selection.
Click the “Apply and Close” button to save your change.
...
Working with Tables
This section explains how to populate, edit, and format your table type report view, including:
...
| Note |
|---|
By default, the format type for all new ad hoc Views is set to the Crosstab type. To build a Table report, change the format type to Table in the “Select Visualization Type” dialog box. |
Using Data Fields in Tables
Insert data into your table-type View by adding data fields. All available fields are listed in the Data Source Selection panel (left column) of the Ad Hoc Editor. The available fields are divided into two sections in the panel:
...
To… | Do this… |
|---|---|
To add fields and measures as columns in your table-type ad hoc View |
|
To remove a field or measure from a table View: | In the Layout Band, click the x next to the field or measure’s name. |
To re-order the fields (columns) in your table View: | In the Columns row in the Layout Band, click and hold a field tab and drag it right or left to a new position |
Using Groups
The Group feature allows you to display detailed groups of data rows in a table View. For example, if you want to create a table View/Report that will list all the CCCApply applications submitted to your college separated by the three residency status values, you would add a group based on the “Residency Status” field - even if the field is not currently being used as a column in your table View. The applications would then be displayed as table rows and grouped into the corresponding residency status values.
The Group feature can be used with any data field included in the data source (domain or topic) selected when creating your new ad hoc View.
You can also use multiple fields to make more specific nested groups. For example, by adding a group based on the applicant’s “State” field to the table described above, the applications would be arranged by State within the residency status groups. Under the “Residency Status = 3” group header row, new header rows would appear for the different states (i.e., Alabama, Alaska, Arizona, Arkansas, and so on) with the applications submitted by students from each state appearing under their respective state names. All groups, as well as data field columns, can be sorted ascending or descending at any time - relative to their respective groupings.
Only fields can be applied to a table as a group; measures cannot be used.
Data is grouped in the table according to the order they have defined. You can change the order by dragging the groups into position if needed.
To… | Do this… | |||||||||
|---|---|---|---|---|---|---|---|---|---|---|
Create a group |
| |||||||||
Remove a group | In the Layout Band, click the x next to the field’s name in the Groups box. | |||||||||
Move a grouping order up or down in a table | In the Layout Band, drag the name of the group you want to move into its new position. |
Displaying Summaries
You can display summary data for any column in your table. Summary data may be in the form of various functions, such as:
...
To… | Do this…. |
|---|---|
To add a summary to a specific column |
|
To remove a summary from a specific column: |
|
Column and Header Labels
You can edit a column or header label directly in the Ad Hoc Editor.
To… | Do this… |
|---|---|
Edit a column or header label |
|
Delete a column or header label: |
|
Re-apply a label: |
|
| Tippanel | ||||||
|---|---|---|---|---|---|---|
| ||||||
If space is at a premium, you can remove labels from the view. When you delete a label, it still appears when you look at the view in the Ad Hoc Editor, but does not appear when you run the report. |
| Panel | ||||||
|---|---|---|---|---|---|---|
| ||||||
For more reportformatting tips, such as managing column sizes and adding spacing to your table-type report, see Working With Tables section of the JasperReports Server v7 User Guide. |
Adding a Title
You can add and edit a title to your ad hoc view using the following steps:
Above the table, click the text Click to add a title.
Enter the new table title in the text entry box.
Changing the Data Format
You can change the formatting for columns containing numeric data, such as dates and monetary amounts. The format is applied to all rows as well as the group- and view-level summaries. By default, non-integer fields use the -1,234.56 data format; integers use -1234.
To change the data format for a column:
In the Ad Hoc view, right-click the column header.
Select Change Data Format from the context menu.
Select the format you want to use. These options vary, depending on the type of numeric data contained in the column.
The data in the column now appears in the new format.
Changing the Data Source
You may need to select a new data source for your table. This is a simple task, but you should keep in mind that all view data and formatting are lost when you select a new Topic, Domain, or OLAP connection. Any changes to the view are also lost if you navigate to another page using the browser navigation buttons, the main menu, or the Search field. To preserve changes, accept the current Topic or click Cancel.
To change the table’s data source:
At the top of the Data Source Selection panel, click and select Change Source.
Select a different Topic, Domain, or OLAP connection.
Click Table to apply the new data source.
OR Click Cancel to return to the editor without changing the Topic.
Controlling the Data Set
You can control the data displayed in the table using the Canvas Options selector. Click to select the option you want to apply to your table.
...
Detailed Data displays table detail only. For instance, in a table listing CCCApply applications submitted to all colleges in a district for a given month, the total apps submitted to each college that month is displayed.
Totals Data displays the table totals only. In the table described above, only the total number of applications submitted that month is displayed.
Details and Totals displays both the individual applications submitted, as well as the totals at the bottom of the columns.
Show/Hide Duplicate Rows displays only the distinct values in your table if you choose to hide the duplicate rows.
Showing Distinct Values
Tables sometimes contain duplicate values in multiple rows, making it difficult to find relevant data. You can choose to show only distinct values in your tables by choosing to hide duplicate rows, making the table shorter and easier to read. To show only the distinct values in a table, click on the Grid Detail Selector and choose Hide Duplicate Rows.
When you choose to hide duplicate rows, all columns will be sorted in ascending order based on their distinct values by default, but columns explicitly sorted in ascending or descending order by the user will have higher priority. Sorting by hidden fields will have no effect.
Understanding & Using Filters (Input Controls)
When a report is created with built-in filters (also known as Input Controls), the Input Controls dialog box will display when the report is run.
...
Click this button in the Input Controls dialog box... | To... |
Apply | run the report but leave the Input Controls dialog box open |
OK | run the report and auto-close the Input Controls dialog box |
Reset | set the field values back to their default after you've edited them; the |
Cancel | close the Input Controls dialog box; click View → Repository to return to the list of data warehouse reports |
Save | to display the Save Values dialog box to save a specific value setting so you can use it easily the next time you run the report The next time you run the report, a drop-down lists displays in the upper left corner so you can select your saved value(s). |
...
| Panel | ||||||
|---|---|---|---|---|---|---|
| ||||||
Relative Date Filters: To filter information in your View based on a date range relative to the current system date, see Creating Filters with Relative Dates. |
| Panel | ||||||
|---|---|---|---|---|---|---|
| ||||||
Creating Filters with Relative DatesYou can filter information in your view based on a date range relative to the current system date. You can accomplish this using date-based filters, and entering a text expression describing the relative date or date span you want to display, using the format <Keyword>+/-<Number> where:
For example, if you want to see all of the CC Promise Grant Applications submitted during the prior week, your expression would be: WEEK-1. |
...
For instance, if you want to display all the CCCApply applications submitted for one month prior to the current date, enter MONTH-1 in the first text input box, and enter today's date (or click “Now”) in the second input box.
| Panel | ||||||
|---|---|---|---|---|---|---|
| ||||||
When you right-click a group member in a Crosstab and select Keep Only or Exclude, you create complex filters. When you create a filter against an inner group, the filter that appears may be created as a complex filter. You can't edit a complex filter, but you can remove it. Complex filters also appear in the Ad Hoc Editor if a Data Chooser filter was created and locked |
| Tippanel | ||||||
|---|---|---|---|---|---|---|
| ||||||
Best Practice Suggestion: When you run a report with a date/time filter, ensure you enter the correct start and end times along with your day, week, month, or year dates to ensure your intended date filter is capturing every second of your expected data results. |
Ad Hoc View Best Practices
Use the following "best practices" as outlined below when working with Views and their associated reports.
General Best Practice | Example |
View/Report Organization |
|
When Creating a View by Copying an Existing View |
|
...
Creating New Ad Hoc Reports
There are two ways to create a new custom report:
...
| Panel | ||||||
|---|---|---|---|---|---|---|
| ||||||
This section may reference features and functionality covered in the Working with the Ad Hoc Editorand the Working with Tables sections. Please refer to these sections as needed. |
Copy and Customize An Existing Report View
A quick and easy way to create a new, custom report is by copying an existing View, making changes to it, and saving it with a new name. This process will save you a lot of time and allow you to focus on customizations. Use the steps below to copy an existing file and create a new one.
| Note |
|---|
Important: To make a change to a saved Report, you must make the change to its original View in the Ad Hoc Editor. |
Copy Steps:
Log in to the Data Warehouse Report Server.
Locate the View file that you want to copy from a folder in the Repository, or in the Library, and click on it.
Copy: With the file name highlighted, copy it using one of the following methods:
Click the Copy button in the tool bar.
Right-click the file name and select Copy from the context menu.
Paste the copy into a folder available to you in the Repository (one of your college or district organization folders).
...
| Panel | ||||||
|---|---|---|---|---|---|---|
| ||||||
You can now customize your new View copy as desired, and save it with a new name. See more Save & Export options below. |
...
Customize & Save View Steps:
Locate the new file you just copied, and click on it. Click the Open button. The View will open in the Ad Hoc Editor.
If desired, you can customize the new View you just copied or saved by using the functional controls in the Ad Hoc Editor. Customization options include:
Add or remove data Columns to your format
Add or remove Groups to your format
Add or remove Filters to further analyze your data
Reorder the columns by dragging the tabs in the Columns or Groups rows.
See the Working with Tables section above for help using the functionality in the Ad Hoc Editor.
When you are ready to save your new View, hover over the Save icon in the tool bar to display the menu options available.
Select Save Ad Hoc View As...
When the Save As dialog box displays:
Edit the Data View Name (required).
Edit the Data view Description field (optional).
Scroll through the list of available Organizations folders to select which folder you want to save your college's report View.
Click Save.
...
Save Ad Hoc View and Create Report Steps:
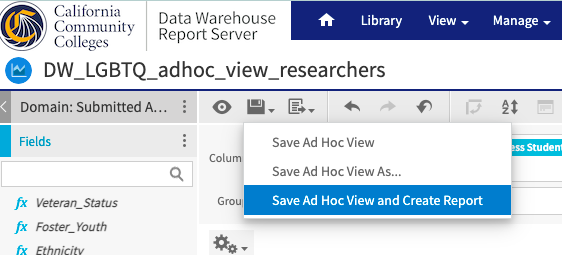
To create a Report from your new ad hoc View copy, click the Save icon again but select the option to Save Ad Hoc View and Create Report from the menu to display the Save Ad Hoc View and Create Report dialog box.
When you are ready to create a Report from your ad hoc View, there is an additional step required.
Hover over the Save icon in the tool bar to display the menu options available.
Select Save Ad Hoc View and Create Report from the menu options.
When the dialog box displays, you must save both the View file and the Report file in the same Save As dialog box.
Add or edit the Data View Name (required).
Add or edit the Data View Description field (optional).
Scroll through the list of available Organization folders and select the folder to save your View file.
Repeat steps 3a - 3c above to save your new Report Name (required), Report Description (optional), and choose your folder using the Create Report dialog fields.
Click Save.
...
| Panel | ||||||
|---|---|---|---|---|---|---|
| ||||||
Review the section The Ad Hoc Editorabove to revisit the components and functionality of the |
...
Ad Hoc Editor |
| Panel | ||||||
|---|---|---|---|---|---|---|
| ||||||
Get Help: See the Video Tutorials available on the Getting Started (Home) page. |
| Notepanel | ||||||
|---|---|---|---|---|---|---|
| ||||||
Dependent ReportsWhen you create a report from an Ad Hoc view, the report is considered “dependent” on that view. When you save an Ad Hoc view, some, but not all, of its changes appear in its dependent reports. For example, if you open an Ad Hoc view with a table and adjust the data level for its columns, the column changes will show up in previous reports created from that view. In cases where changes to an Ad Hoc view could cause errors in dependent reports, you should save the updated view with a different file name and create a new report. |
Create a New Ad Hoc Report View from Scratch
To create your own custom report you must first create an ad hoc View for it with a data source, a format type, one or more data fields and filters. This can be done by following the steps and best practices provided below.
| Panel | ||||||
|---|---|---|---|---|---|---|
| ||||||
You create these views by simply dragging and dropping elements. You can add and summarize fields, define groups, label and title the report, and format data for each field. The effects of your changes are evident immediately, and you can adjust the display to highlight the most relevant and compelling aspects of your data. | ||||||
| Panel | ||||||
|---|---|---|---|---|---|---|
| ||||||
Reminder: In order to create a new ad hoc report, you must first design the report in the Ad Hoc Editor and save it as a View. Then it can be saved and run as a report. |
Steps:
Log in to the Data Warehouse Report Server.
From the main menu, select Create > Ad Hoc View to display the Select Data dialog box.
...
| Panel | ||||||
|---|---|---|---|---|---|---|
| ||||||
Alternatively you can click the Ad Hoc Views workflow icon on the Getting Started/Home page. |
...
3. Select the Data Source: From the Select Data dialog box, scroll to find the Topic or data source you want to use for your report View. Highlight the data source and click “Choose data…”.
...
| Panel | ||||||
|---|---|---|---|---|---|---|
| ||||||
Data Warehouse-related data sources have a "DW" in the name of the source and "Topic" as a part of their name. |
| Panel | ||||||
|---|---|---|---|---|---|---|
| ||||||
NOTE: Hover over the data source name to see its description and path information. |
4. Choose Your Data Fields: On the Choose Data screen, you are able to bring in all the data fields from your selected data source, or you can select individual fields that you want to include in your new ad hoc view. Most users will choose all data fields.
...
6. Add Data Fields and Groups: In the Ad Hoc Editor, the data fields from your data source will appear in the Data Selection Panel (left column). See the Using Data Fields in Tables section for steps.
A. Click on a data and hold field; drag it into the canvas area (Ad Hoc View Panel). The data will display in a column in the canvas area.
...
7. Add Filters (optional). See the Understanding & Using Filterssection for steps.
8. Add a Summary (optional). See the Displaying Summaries section for steps.
9. Edit Column Header Labels (optional). See the Columns & Header Labels section for steps.
10. Add a Title. See the Adding a Title section for steps.
11. Save Your View and Create Report. See the Save Ad Hoc View and Create Report section for steps.
12. Run and review your report. Locate your report file where you saved it (Repository) or in the Library, and run your new report to ensure it captures all the data and customizations needed.
...
it captures all the data and customizations needed.
| Panel | ||||||
|---|---|---|---|---|---|---|
| ||||||
Recommendation: When saving your ad hoc view and report, it’s very helpful to make the names and descriptions the same, or similar, in order to manage future changes. |
| Panel | ||||||
|---|---|---|---|---|---|---|
| ||||||
Review the Running Reports & The Report Viewersection for a refresher on using report filters & conditional formatting, and steps to Saving & Exporting Your Report. |
...
Support Using the Report Server
Contact College Support to report technical issues with the Data Warehouse Report Server - or visit our online community support site, CCCTechnology.info.
...
Part 5: Report Templates
The Data Warehouse Report Server is a structured source of master data that can be used to generate the reports, templates, data marts, and analytics that end-users need.
...
ready-to-use standard reports specific to single application data instances
ready-to-use CCC Data Warehouse reports specific to one of the following application data sources:
Canvas
CCCApply Standard application
CCCApply International application
California College Promise Grant application
MyPath
Report Overviews:
...
DW LGBTQ Report
The Data Warehouse (DW) LGBTQ Report is a ready-to-use report produced from the sensitive CCCApply data available only in the CCC Data Warehouse.
...
run the preconfigured LGBTQ report that pulls CCCApply data from the CCC Data Warehouse
create a custom LGBTQ report "View" from which you can customize the LGBTQ report data
Running the DW LGBTQ Report
To run the ready-to-use DW LGBTQ Report template in Public folder in the Repository, use the steps below.
Log in to the Data Warehouse Report Server with your authorized user account.
Click View → Repository to display the Repository folders in the navigation panel on the left side of the screen.
From the navigation panel, open the Public folder → Data Warehouse folder → DW Reports folder to display the available reports for the Data Warehouse, including the DW_LGBTQ_Report.
Click the DW_LGBTQ_Report link to run the report.
...
| Panel | ||||||
|---|---|---|---|---|---|---|
| ||||||
Any of the templates in the Public folders in the Repository contain resources that can be run directly or “copied and pasted” into your college Organization folders for customization. |
|  |
2. From the navigation panel (left column), open the Public folder → Data Warehouse folder → DW Reports folder to display all the available report templates for the Data Warehouse, including the DW_LGBTQ_Report. 3. Select the DW_LGBTQ_Report link and double-click to run the report. (Alternately, highlight the report link and click the “Run” button in the toolbar.) | 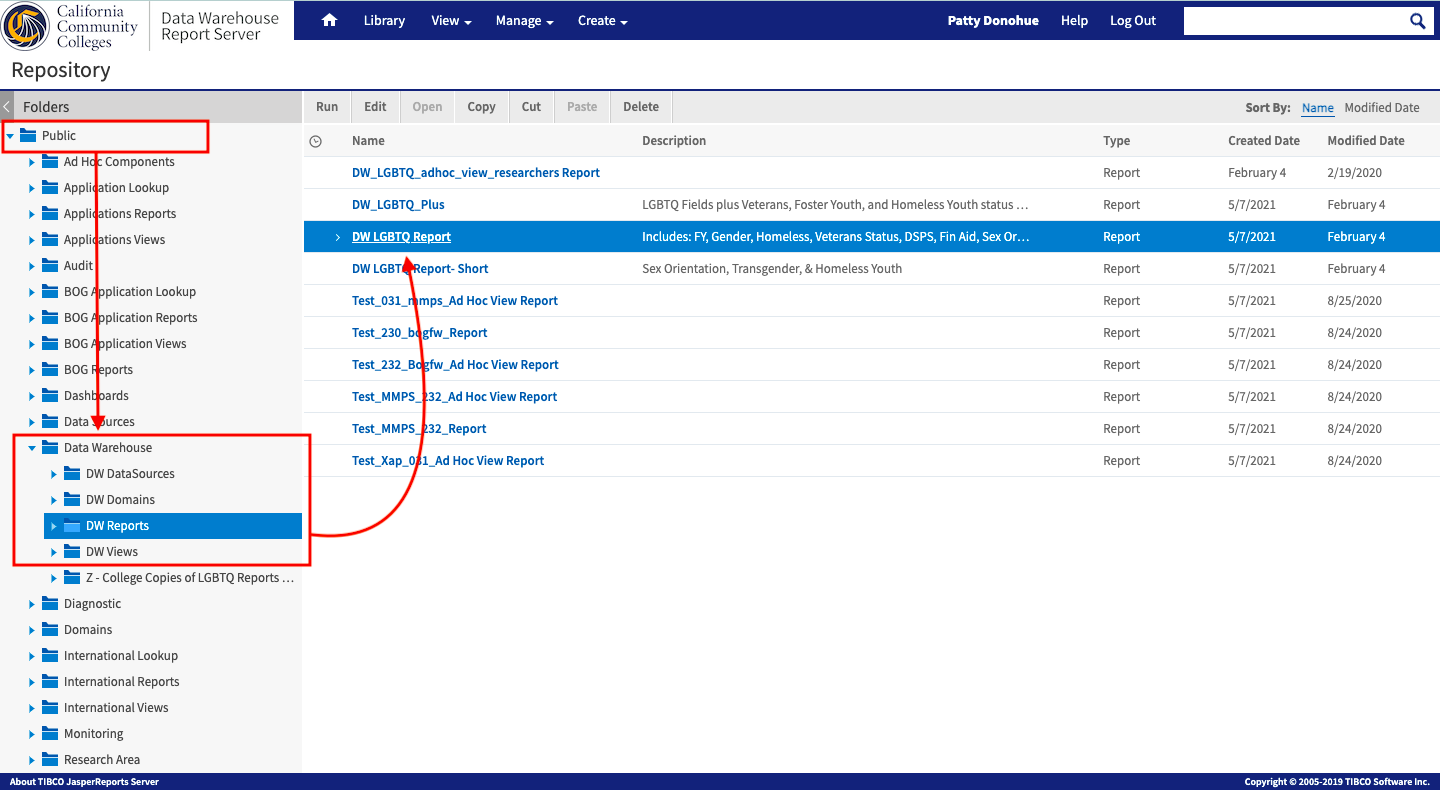 |
...
| Note |
|---|
Due to the sensitive nature of LGBTQ report details, the image above was created using test data and no personal identity information was used. |
Using the Input Controls to Filter Your Report Data
If you want to narrow the report's results to a different time range from the default, click the Options icon to display the Input Controls dialog box and enter date/time fields to specify a new date range.
...
Click the… | To… |
|---|---|
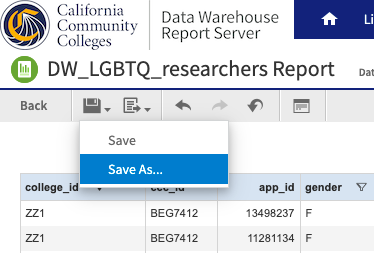
Save icon and select Save | save the report to your college or district default Reports folder |
Save icon and select Save As | display the Save As dialog box where you can select a different folder to save your report: |
Export icon | select an export format that auto-downloads to your computer's hard drive default download location |
...
| Panel | ||||||
|---|---|---|---|---|---|---|
| ||||||
To return to the Repository: After running and/or exporting the LGBTQ report, click View → Repository to return to the repository to view the list of reports. |
Customizing the LGBTQ Report Template
The process to create and save a custom version of the LGBTQ report template in the Repository, or any report template in the Data Warehouse Report Server, will depend on what you want changed and whether the change is temporary (one-off) or if you want to make long-term changes to the format, the data source, the data elements, and/or different or additional Input Controls (filters).
...
Step 1: Locate and select the corresponding Ad Hoc View template of the report you want to customize from the Public > Data Warehouse > DW Views folder.
...
| Panel | ||||||
|---|---|---|---|---|---|---|
| ||||||
The steps to customize an existing Report template apply to any/all existing templates that your user account is permitted to access, including the templates in the Public folders. |
...
Step 4: With your copy of the Ad Hoc View open in the Ad Hoc Editor, follow the information provided in Part 4: Creating Custom Ad Hoc Views & Reports in this guide.
| Panel | ||||||
|---|---|---|---|---|---|---|
| ||||||
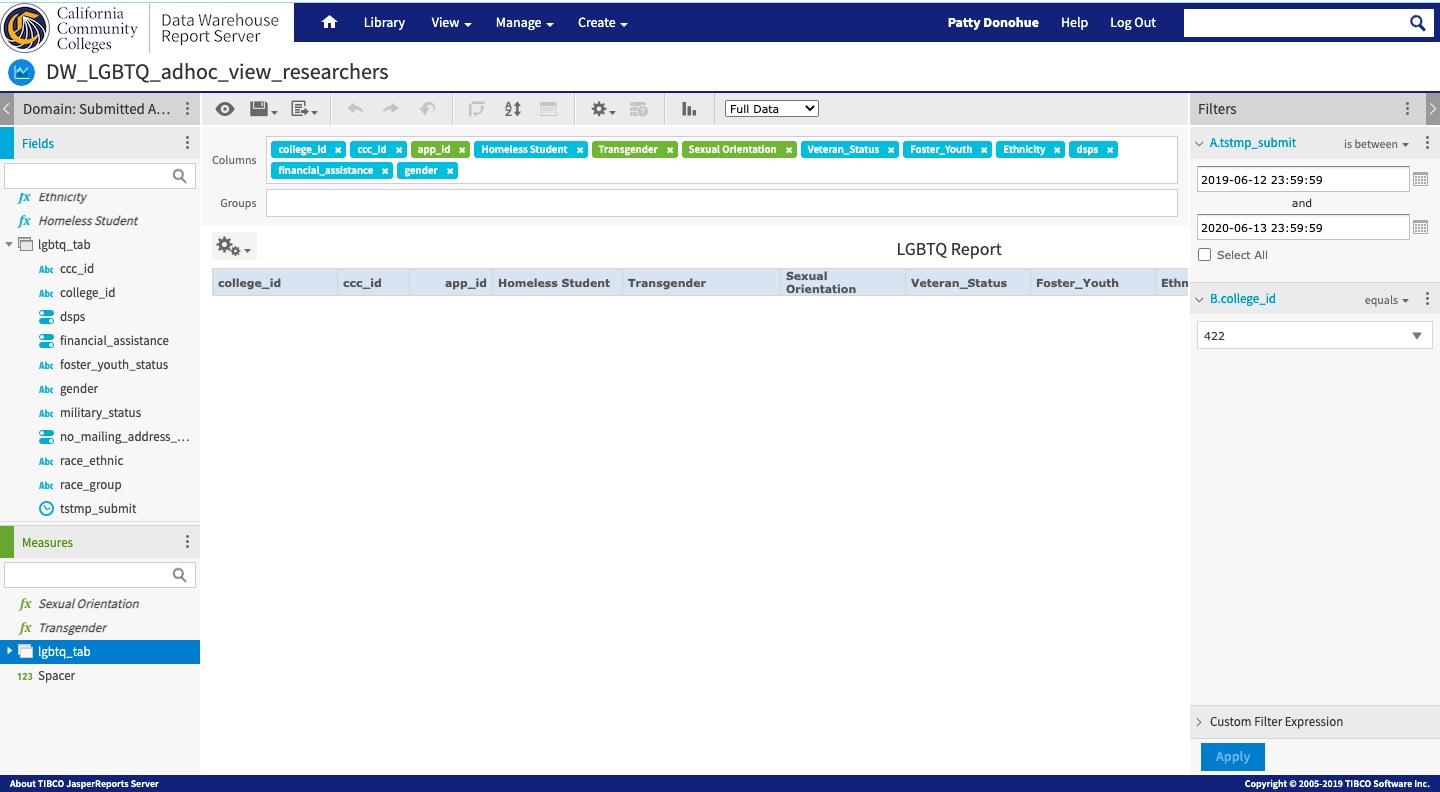
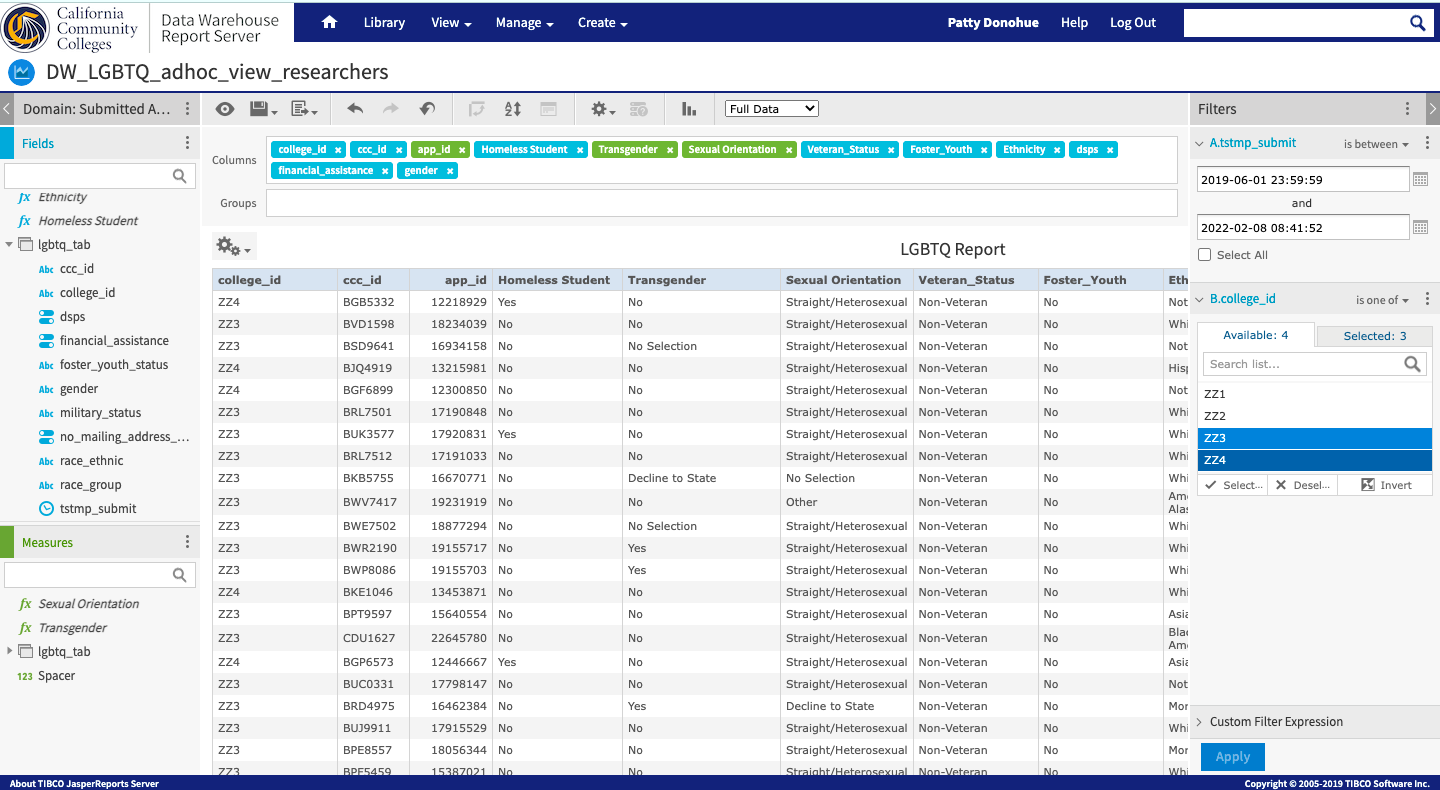
Note: When you first open the copy of the Ad Hoc View, the initial view will depend on the default Input Controls set in the Filters column (if any). |
Your copy of the Ad Hoc View may appear without any data rows displayed due to the input control filters set. Review and update the filters as needed. | The screenshot below shows the same Ad Hoc View with the filters updated. |
 |  |
...
|
| Panel | ||||||
|---|---|---|---|---|---|---|
| ||||||
For more guidance, see Copy and Customize An Existing Report Viewpreviously in this guide. |
| Tippanel | ||||||
|---|---|---|---|---|---|---|
| ||||||
Optional: To change the report format type of the Ad Hoc View and eventually your Report template, follow the steps below. |
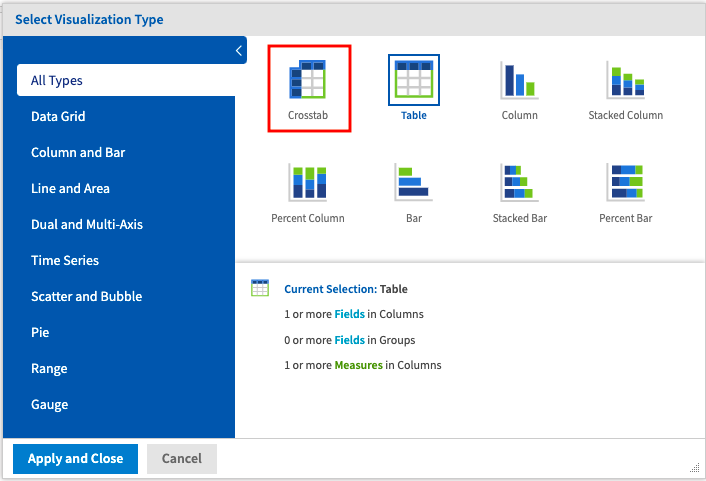
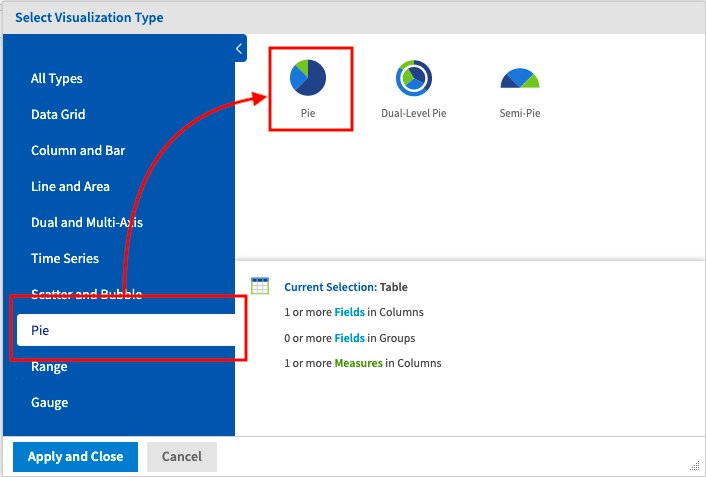
To change the format of the Ad Hoc View, click the Select Visualization Type icon in the Ad Hoc Editor toolbar to display the Select Visualization Type dialog box. | To create a Crosstab type View/Report, click on the Crosstab icon, then click the Apply and Close button at the bottom of the dialog box. | To create a pie chart type View/Report, click the Pie link in the left menu, then select your preferred pie icon. Then click the Apply and Close button at the bottom of the dialog box. |
 |  |
...
| Panel | ||||||
|---|---|---|---|---|---|---|
| ||||||
Optional: To add or remove data fields to your custom Ad Hoc View, follow the process below. |
...
In the example above, you will now see “birthdate” as an available data field in the Fields column and can be used in your report.tip
| Panel | ||||||
|---|---|---|---|---|---|---|
| ||||||
Optional: To add or remove Input Controls (filters) in your Ad Hoc View, please refer to the section Understanding & Using Filters (Input Controls) in this guide. |
The Filterscolumn is the right column panel in the Ad Hoc Editor. Any filters that were added when the Ad Hoc View template originally will appear in the Filters column. These filters can be revised or removed, and the operator for each filter can be changed. | 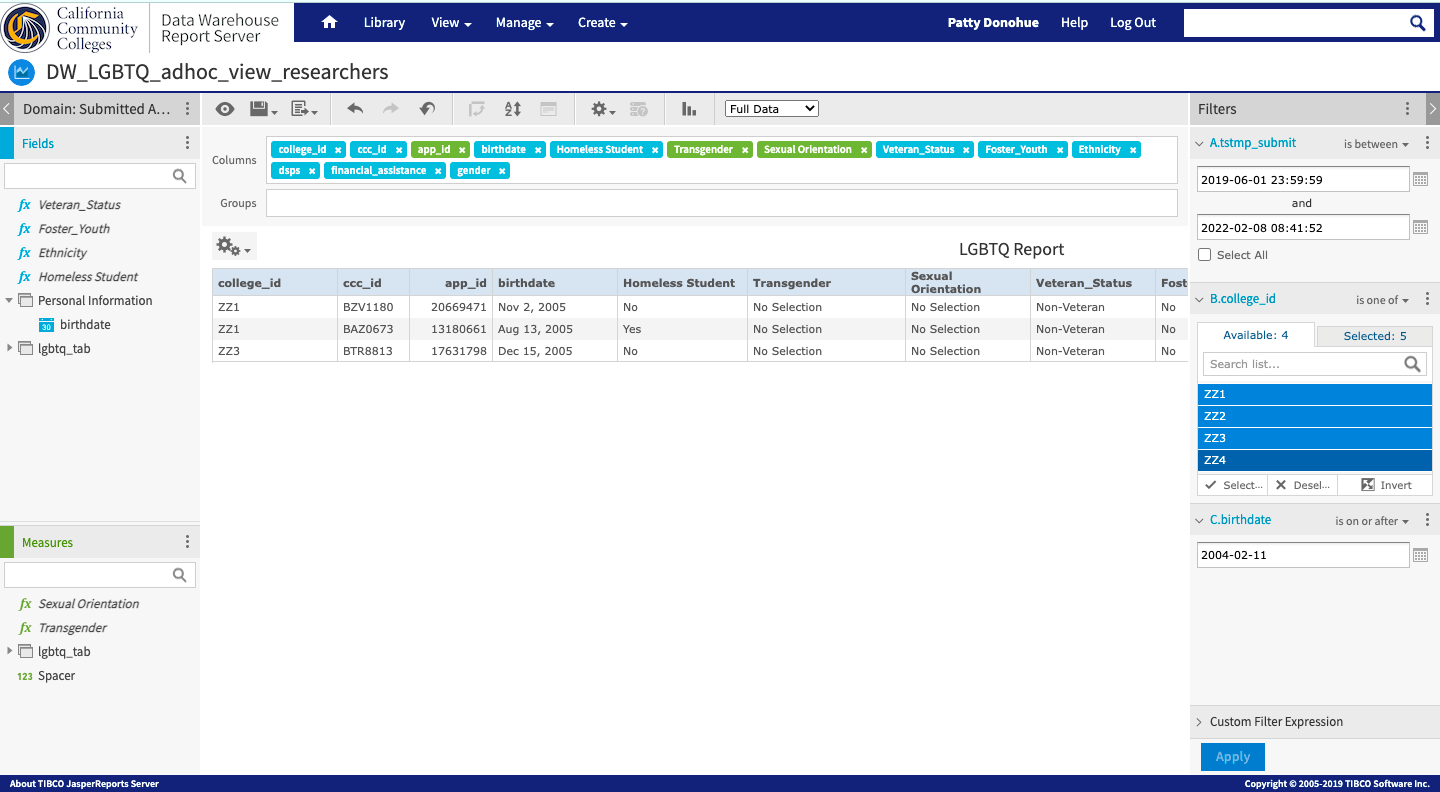 | |||||||||
A Filter can be created from any data field that is visible in the Ad Hoc Editor for use in your Ad Hoc View. Filters cannot be created using fields that are not visible in your Ad Hoc View. In the screenshot to the right, the two filters displayed were added when the Ad Hoc View template was first created are based on “tstmp_submit” and “college_id”. | | |||||||||
To add a new filter to your Ad Hoc View, right click on your selected field in the Data Field Selection panel and click on Create Filter from the context menu. The new filter will then be added to the Filters panel. | 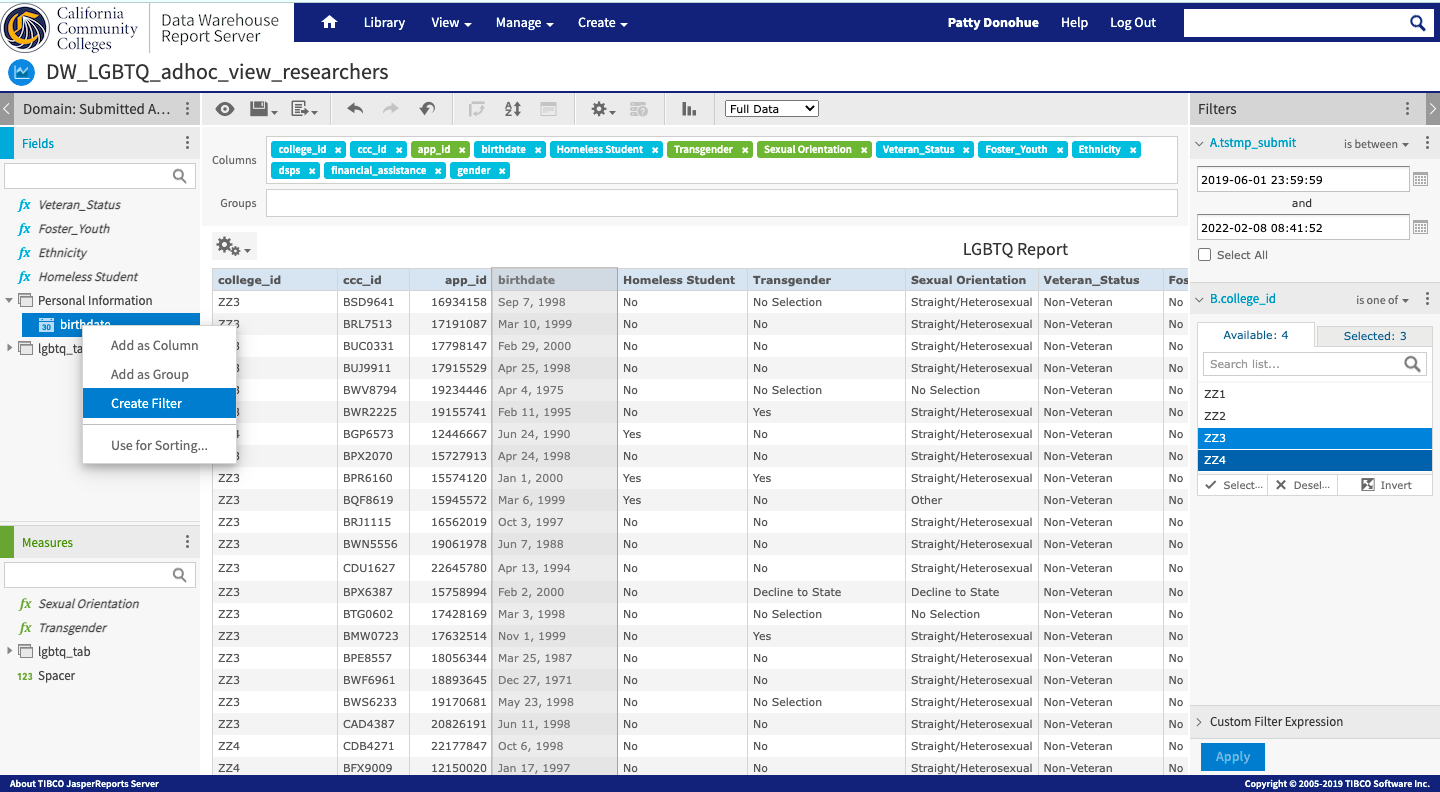 | |||||||||
Once the new filter has been added to the Filters panel, open the Change Operator menu and select the appropriate operator that will be used to filter your data.
| 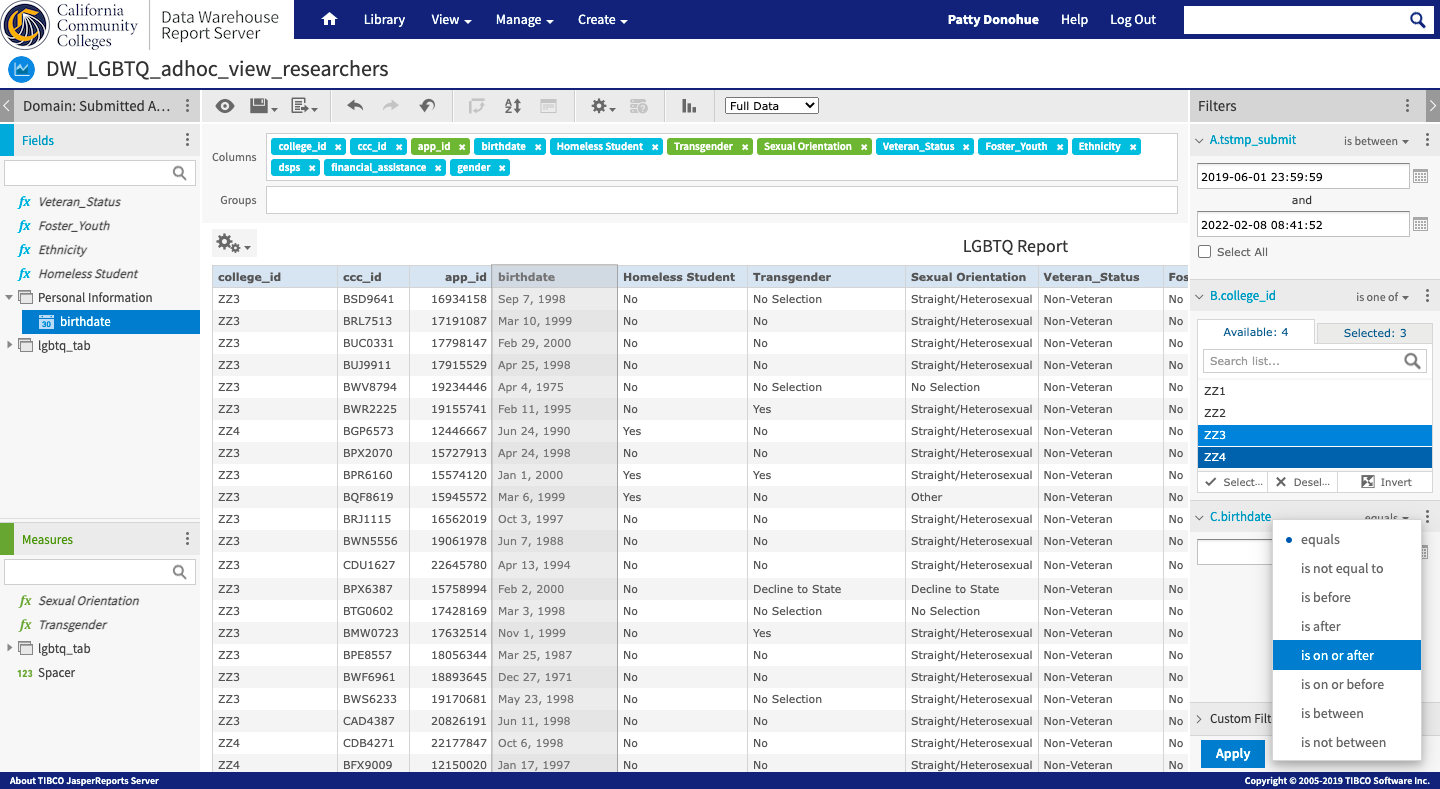 | |||||||||
However, by changing the operator to “is on or after”, the filter will display all results where the “birthdate” is on or after the date entered. | 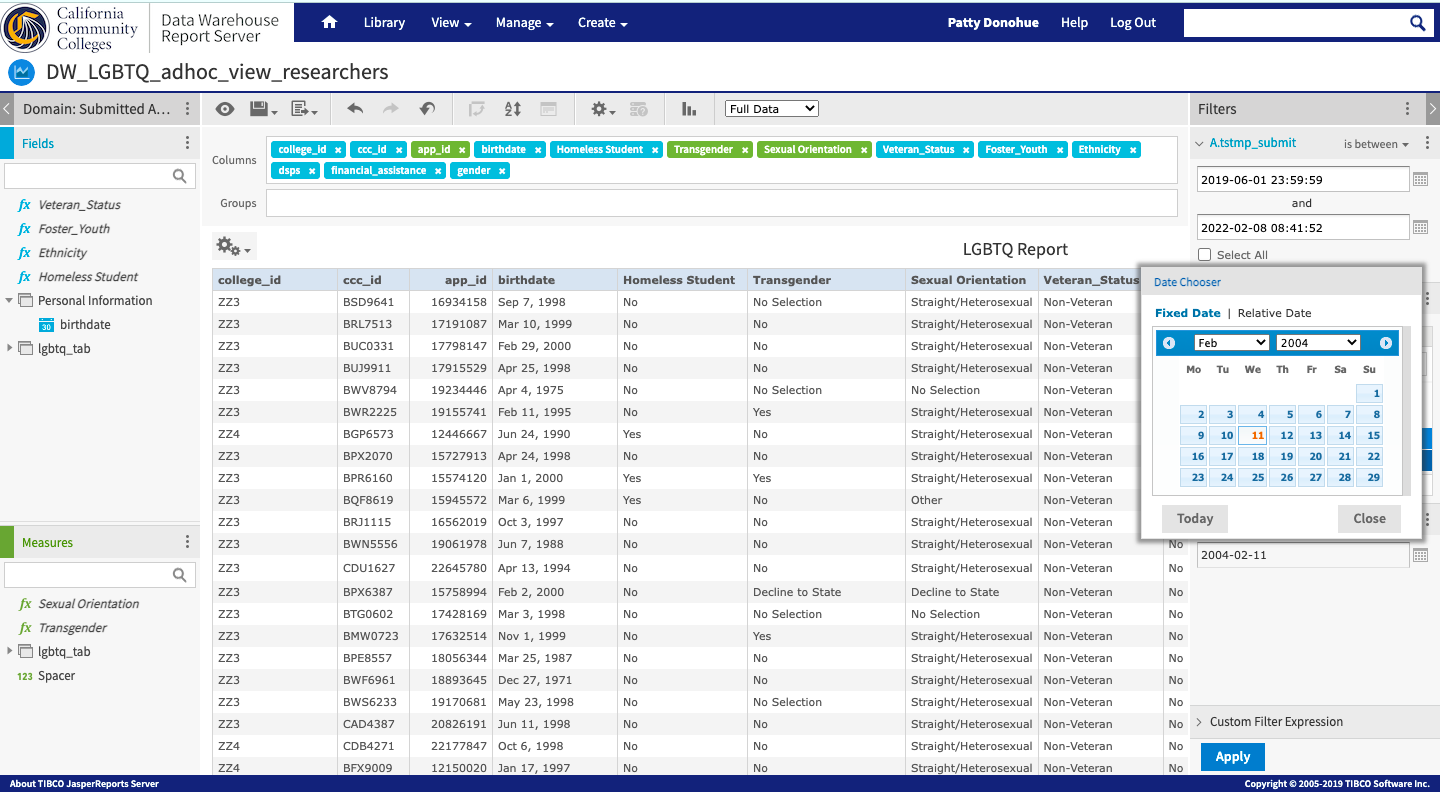 |
...
| Panel | ||||||
|---|---|---|---|---|---|---|
| ||||||
Optional: To add a Group to your table type template, right-click on the data field you want to use to group or segment your data rows and select Add Group. |
...
Step 4A: Click the Save icon in the Ad Hoc Editor tool bar. | Step 4B: In the dropdown menu, select Save Ad Hoc View and Create Report to open the Save As dialog menu. | Step 4C: In the Save Ad Hoc View and Create Report dialog box, enter the names of your View and Report, and designate the folders where each will be saved. |
 |  | 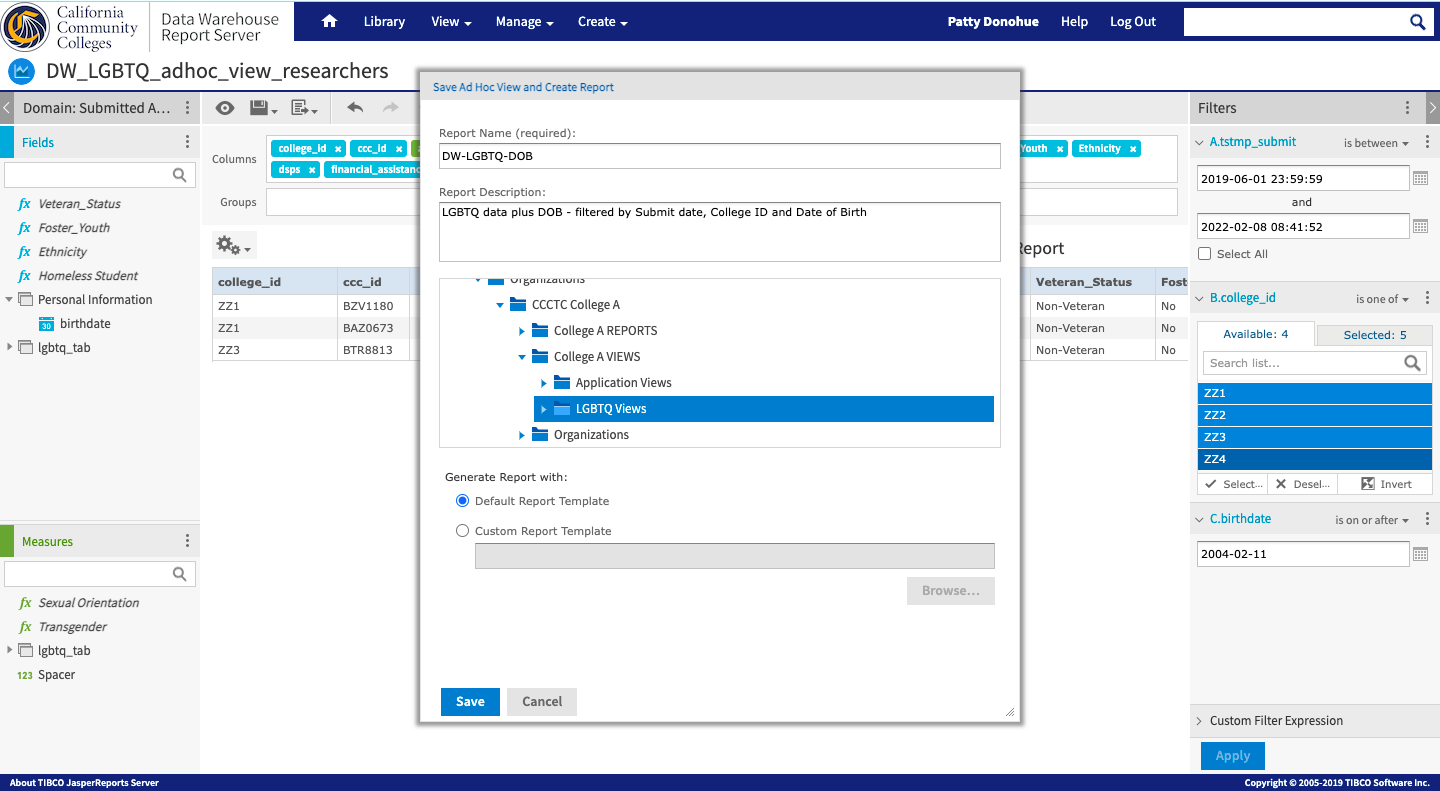 |
...
| Panel | ||||||
|---|---|---|---|---|---|---|
| ||||||
Helpful Tip: When saving the details of your custom Ad Hoc View and corresponding Report, keep the names and descriptions the same - or very similar - so you can identify the pair if you want to update your report in the future. Remember that every report is based on its original View, and if you want to change your report you need to make the changes in the corresponding View, and then save the changes as a new report. |
...