| Info |
|---|
CCC Data Warehouse Report Server v7.8 Last Update: Feb 2022 |
...
Authenticator for Mac and Windows Chrome browsers is available free from the Chrome Web Store. This app installs very quickly to your desktop (recommended) as well as your phone, and includes a lot of great features that promote security and usability. NOTE: The entire download and install process takes less than one minute. You may need local IT authorization and assistance to install it if policy requires this.
To Install the Chrome Authenticator:
...
To run a report, click the name of a report in the repository. For example, click DW LGBTQ Report. The report appears in the Report Viewer.
...
On the Home page, click Create in the Reports block. The Create Report wizard opens.
Select the Ad Hoc view you want to use as the basis for your report.
Select a report template. To use a template other than the default, select Custom Report Template, click Browse and select the desired template. See Report Templates for more information.
Click OK. If asked, enter the input controls needed. See Using Input Controls.
You can now begin working with your report.
...
| Info |
|---|
Creating Filters with Relative DatesYou can filter information in your view based on a date range relative to the current system date. You can accomplish this using date-based filters, and entering a text expression describing the relative date or date span you want to display, using the format <Keyword>+/-<Number> where:
For example, if you want to see all of the CC Promise Grant Applications submitted during the prior week, your expression would be: WEEK-1. |
...
Log in to the Data Warehouse Report Server with your authorized user account.
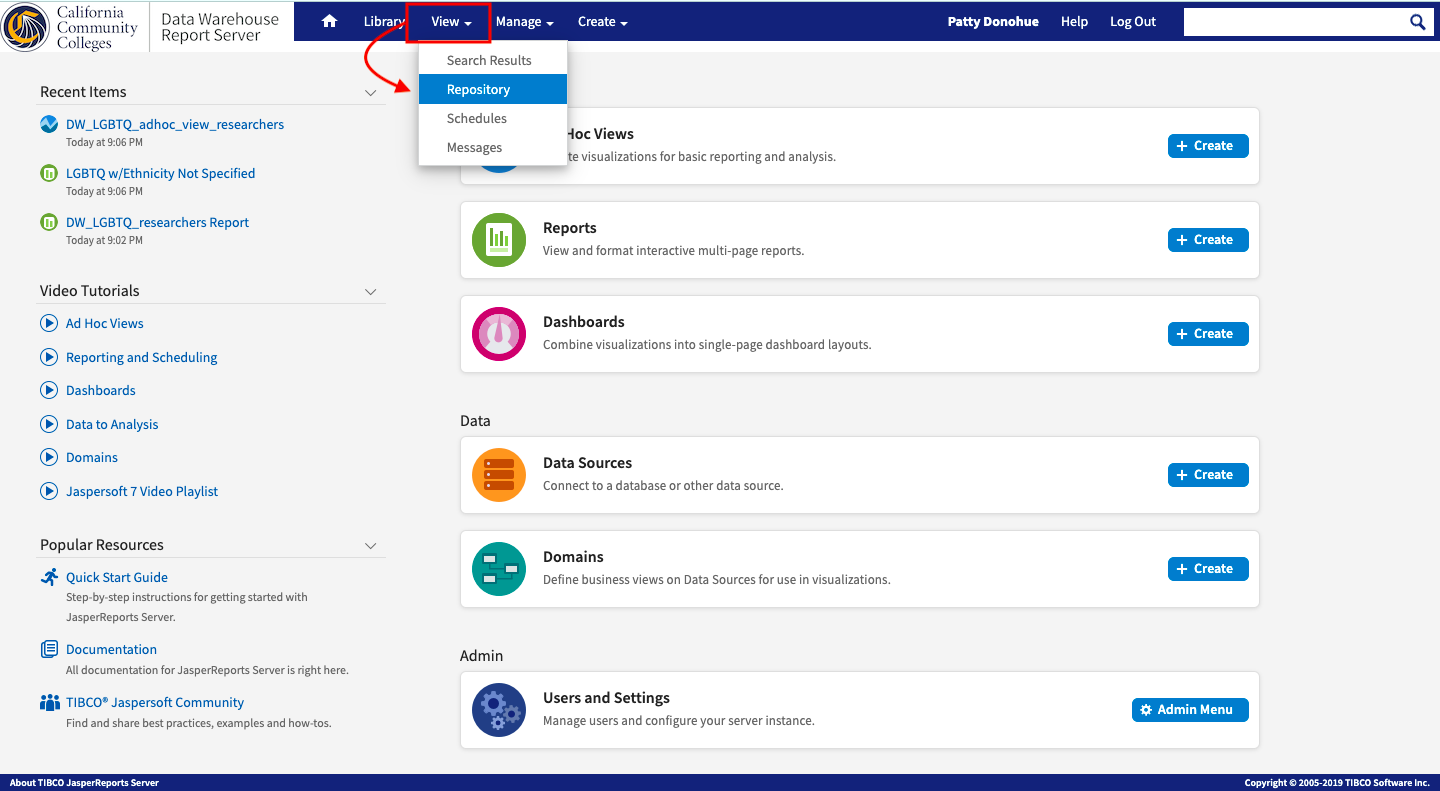
Click View → Repository to display the Repository folders in the navigation panel on the left side of the screen.
From the navigation panel, open the Public folder → Data Warehouse folder → DW Reports folder to display the available reports for the Data Warehouse, including the DW_LGBTQ_Report.
Click the DW_LGBTQ_Report link to run the report.
| Tip |
|---|
For detailed information on getting to the Data Warehouse Report Server and signing in with your authorized login credentials, see Getting to the Report Server in this user guideAny of the templates in the Public folders in the Repository contain resources that can be run directly or “copied and pasted” into your college Organization folders for customization. |
|  |
2. From the navigation panel (left column), open the Public folder → Data Warehouse folder → DW Reports folder to display all the available reports report templates for the Data Warehouse, including the DW_LGBTQ_Report. 3. Click Select the DW_LGBTQ_Report link and double-click to run the report. (Alternately, highlight the report link and click the “Run” button in the toolbar.) | 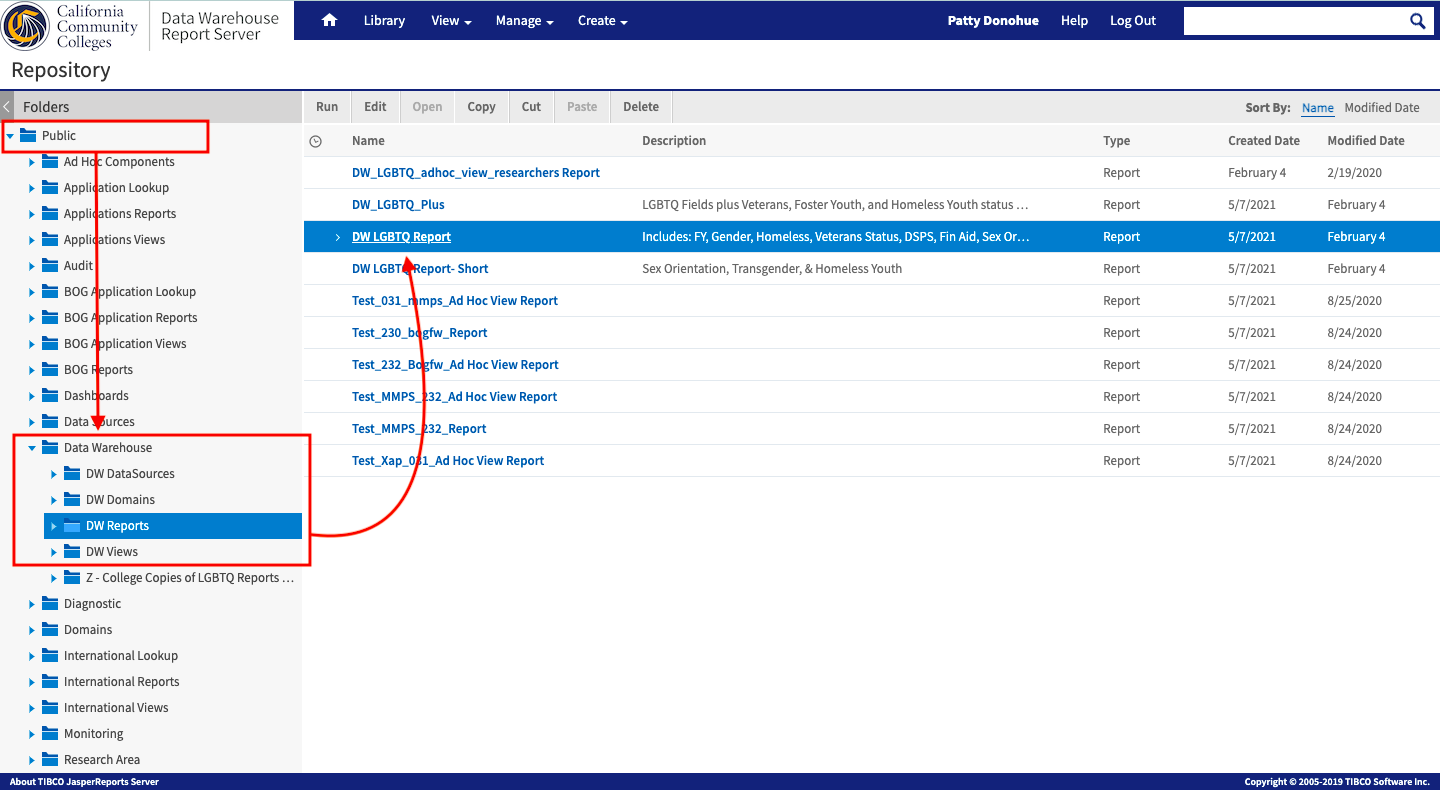  |
Below is an example of the DW_LGBTQ_Report report that displays in the Report Viewer.
...
| Note |
|---|
Due to the sensitive nature of |
...
LGBTQ report details, the image above was created using test data and no personal identity information |
...
was used. |
Using the Input Controls to Filter Your Report Data
4. If you want to narrow the report's results to a different time range from the default, click the Options icon to display the Input Controls dialog box and enter date/time fields to specify a new date range.
...
5. Click Apply to apply the new date range. The report will run and display results within the new date/time range you specified. The Input Controls dialog box continues to display allowing you to change the values if needed. Click OK to close dialog box.
...
Click this button in the Input Controls dialog box... | To… |
|---|---|
Apply | run the report but leave the Input Controls dialog box open |
OK | run the report and auto-close the Input Controls dialog box |
Reset | set the field values back to their default after you've edited them; the Input Controls dialog box remains open |
Cancel | close the Input Controls dialog box; click View → Repository to return to the list of data warehouse Data Warehouse reports |
Save | display the Save Values dialog box to save a specific value setting so you can use it easily the next time you run the report; screen shot |
The next time you run the report, Saved Values | see a drop-down lists displays in the upper left corner so you can select your saved value(s). screenshot |
...
list of values saved previously. |
Save your report by clicking the Save/Save As... icon :
...
And then export the report into in the toolbar.
...
ToExportyour report, click the Export icon from the toolbar and choose from a variety of file formats.
...
To export as a PDF, the report will open in a new browser tab which can be downloaded as a PDF file.
...
| Note |
|---|
Due to the sensitive nature of the LGBTQ report details, the report above is based on test application data and include no personal identity information. |
Click the… | To… |
|---|---|
Save icon and select Save | save the report to your college or district default Reports folder |
Save icon and select Save As | display the Save As dialog box where you can select a different folder to save your report:screenshot |
Export icon | select an export format that auto-downloads to your computer's hard drive default download location |
...
| Tip |
|---|
To return to the Repository: After running and/or exporting the LGBTQ report, click View → Repository to return to the repository to view the list of reports. |
Customizing the LGBTQ Report Template
...
Step 3: With your copy of the Ad Hoc View open in the Ad Hoc Editor, follow the steps provided in the XYZ section in the guide.
...

Optional: To change the report format type…type, follow the steps below.
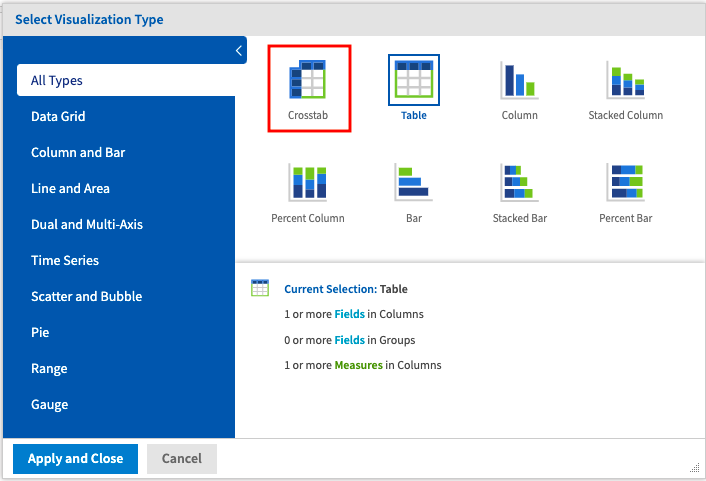
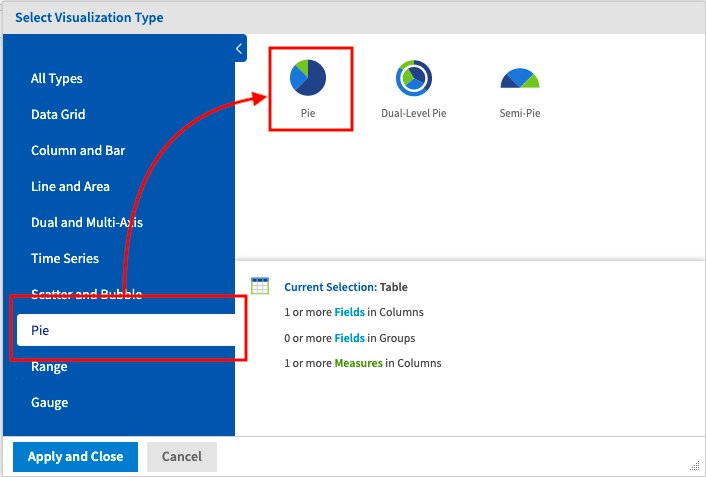
To change the format of your custom report, click the Select Visualization Type icon in the Ad Hoc Editor toolbar to display the Select Visualization Type dialog box. | To create a Crosstab type report, click on the Crosstab icon, then click the Apply and Close button at the bottom of the dialog box. | To create a pie chart type report, click the Pie link in the left menu, then select your preferred pie icon. Then click the Apply and Close button at the bottom of the dialog box. |
 |  |
...
Option: To add or remove Input Controls in the report, do this…
| |
Option: To add a Group to your table report, do this…
...