| Info |
|---|
CCC Data Warehouse Report Server v7.8 Last Update: May 2021 |
In This User Guide
| Table of Contents | ||||
|---|---|---|---|---|
|
Part 1: Overview
...
| Info |
|---|
CCC Data Warehouse Report Server v7.8 Last Update: May 2021 |
In This User Guide
| Table of Contents | ||||
|---|---|---|---|---|
|
Part 1: Overview
The information provided in this document serves as a "Quick Start" guide for the CCC Data Warehouse Report Server (“DW Report Server”). With the DW Report Server you can:
...
Authorized access correspond directly to the user’s college or district 3-digit MIS Code, as shown in the table below.
User Type | Authorized Access Level |
College User | Single college access to available data sets based on College MIS Code |
District User | Multi-college access to available data sets based on District MIS Code |
Chancellor's Office User | Access to all data sets across all colleges |
The Account Creation & User Setup Process
...
Authenticator for Mac and Windows Chrome browsers is available free from the Chrome Web Store. This app installs very quickly to your desktop (recommended) as well as your phone, and includes a lot of great features that promote security and usability. NOTE: The entire download and install process takes less than one minute. You may need local IT authorization and assistance to install it if policy requires this.
To Install the Chrome Authenticator:
...
The Getting Started (Home) page displays the following items:
Getting Started Page Sections | Allows you to: |
Header bar Menu Items |
On the right side of the header bar, you can:
|
Getting Started Column |
|
Core Workflow Icons |
|
Note: It is expected that most DW Report Server users will use the Ad Hoc Views, Reports, and Dashboards resources. These topics are covered in this guide while details for other Report Server tool functionality is available in the JasperReports Server v7 online help documentation, which is accessible via the Help link in the top-right side of the header bar menu.
...
The Repository is the server’s internal storage for folders, reports, analysis views, and related files. The Repository is organized as a structure of folders containing public and private resources and templates, as well as Organization folders, much like a file system.
To… | You… | Allows you to… |
|---|---|---|
Display the Repository page | select View > Repository from the header menu (from any page) | view and access the contents you are authorized to view in the Repository. |
Browse the Repository | click to expand a folder name (Public or Private folder) in the Folders panel | view and access the reports, themes, and other content files stored on the server that you have permission to view. |
Search the entire Repository | select View > Search Results from the header men (from any page) | display the Search Results page and search the entire Repository using intuitive search criteria, such as who modified a resource and when, to find pinpoint resources. |
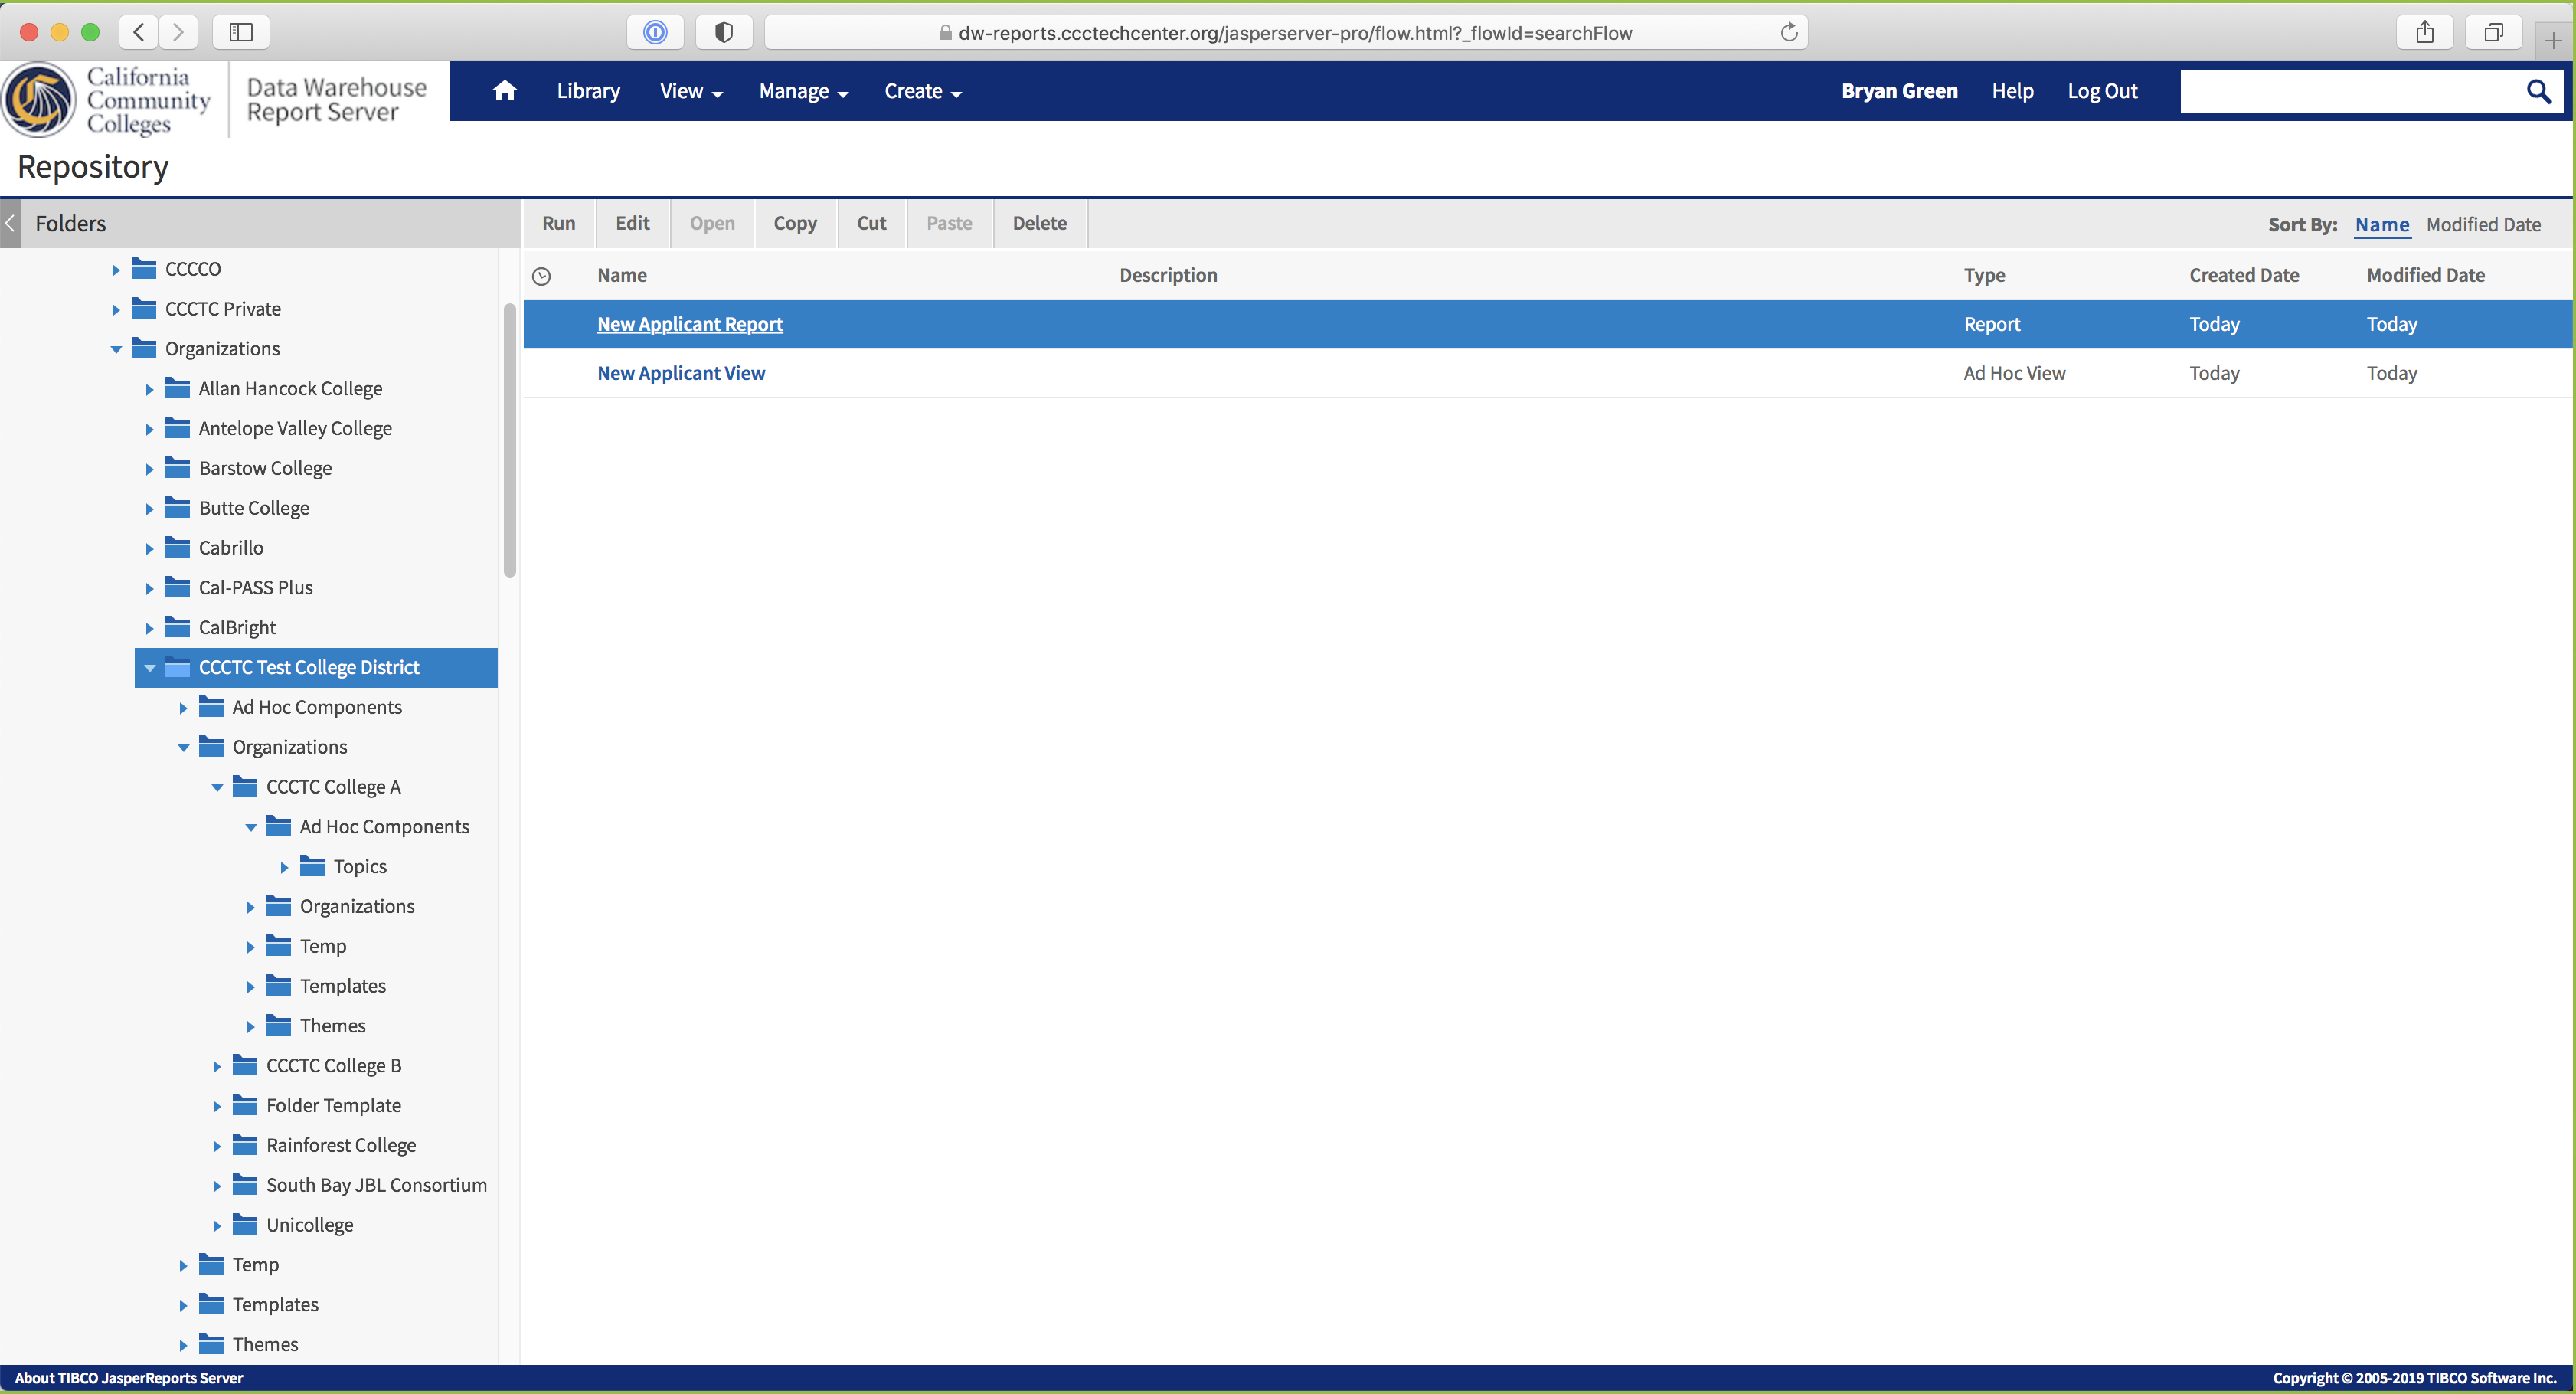
List of resources in the Repository in a district organization's folder.
...
The Report Viewer allows you to view a report, export content to various output formats, and apply formatting, sorting, and filters to control how the data is displayed. This section describes the functions available in the Report Viewer.
Running a Report
...
To open and run a report in the Report Viewer:
Log in to the Data Warehouse Report Server.
Locate your report file in the Library or a folder in the Repository.
Repository: Click View > Repository from the main menu.
Library: Click Library link from the main menu.
Click the report name and then click the Run button in the tool bar. Alternately, right-click the report name and select Run from the menu.
The report will open in the Report Viewer.
...
| Warning |
|---|
IMPORTANT: There is a 200K row limit on all reports that are run. When building a Table report, ensure there is one or more filters configured to limit the report data to display under 200,000 rows. |
Running or Creating a Simple Report
You can view and work on a report in the Report Viewer in a number of ways:
Running an instance of an existing report
Creating a new report from an existing Ad Hoc view
Running a Simple Report
This section describes how to run a tabular report that lists account data.
To run a report:
Log into the Report Server with your authorized user account.
On the Home page, click View list in the Reports block.
The search results appear, listing your own files and other files that your user account has permission to view.
To run a report, click the name of a report in the repository. For example, click DW LGBTQ Report. The report appears in the Report Viewer.
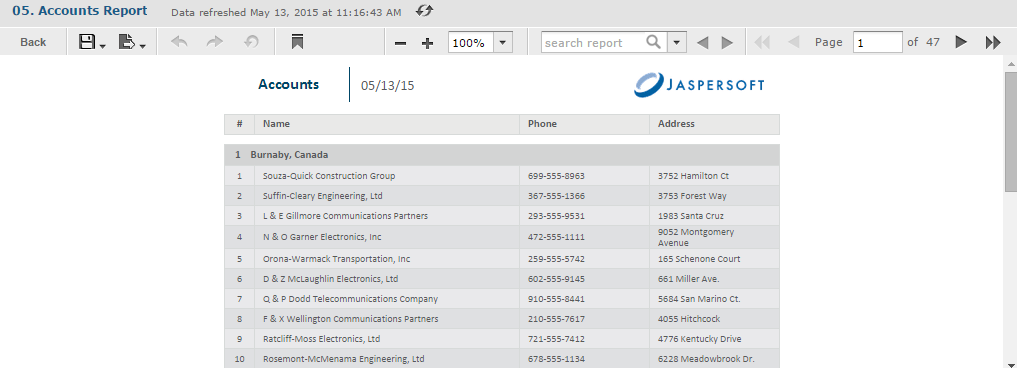 |
Output of the DW LGBTQ Report. |
NOTE: If you are running a report with multiple pages, the first page of the report appears before the entire report is loaded. You can begin scrolling through report pages as they load, as indicated in the pagination controls in the upper left corner of the Report Viewer.
If you want to cancel loading the report before it is complete, click the Cancel Loading button that appears next to the pagination controls.
Creating a Report
You can create a report directly from the Report Server Home page. This method allows you to select an existing Ad Hoc view and generate a report from it, without going through the Ad Hoc Editor.
To create a report from the Home page:
On the Home page, click Create in the Reports block. The Create Report wizard opens.
Select the Ad Hoc view you want to use as the basis for your report.
Select a report template. To use a template other than the default, select Custom Report Template, click Browse and select the desired template. See Report Templates for more information.
Click OK. If asked, enter the input controls needed. See Using Input Controls.
You can now begin working with your report.
Report Templates
When you create a report, the Create Report wizard displays layout options for generating and exporting the report:
Default Report Template applies basic layout options to your report. This is usually the Actual Size template.
Custom Report Template allows you to browse to an existing template. JasperReports Server includes a number of templates are available by default, including:
A4 Landscape
A4 Portrait
Actual Size
Letter Landscape
Letter Portrait
Report Generator allows you to create a highly customized report design. This option is not often enabled. See your JasperReports Server administrator for more information.
Most commonly, you will choose Default Report Template.
Using Report Templates for PDF
If you are exporting your report to PDF, choose your option based on the size of the output.
For most PDF exports, you can use Actual Size, which supports a maximum size of 14400px by 14400px.
For reports with an output height exceeding 14400 px, use a paginated report template that is wide enough for your report. For example, if you have a long report with width less than 842px, you can use the paginated A4 Landscape theme.
Reports with output width exceeding 14400 px will be truncated in PDF. Redesign your report or use a different export format.
Running Reports with Input Controls (Filters)
...
To save or export your report, use the actions in the table below.
Click the... | To... |
Save icon and select Save | save the report to the default DW Reports folder |
Save icon and select Save As | display the Save As dialog box where you can select a different folder to save your report: 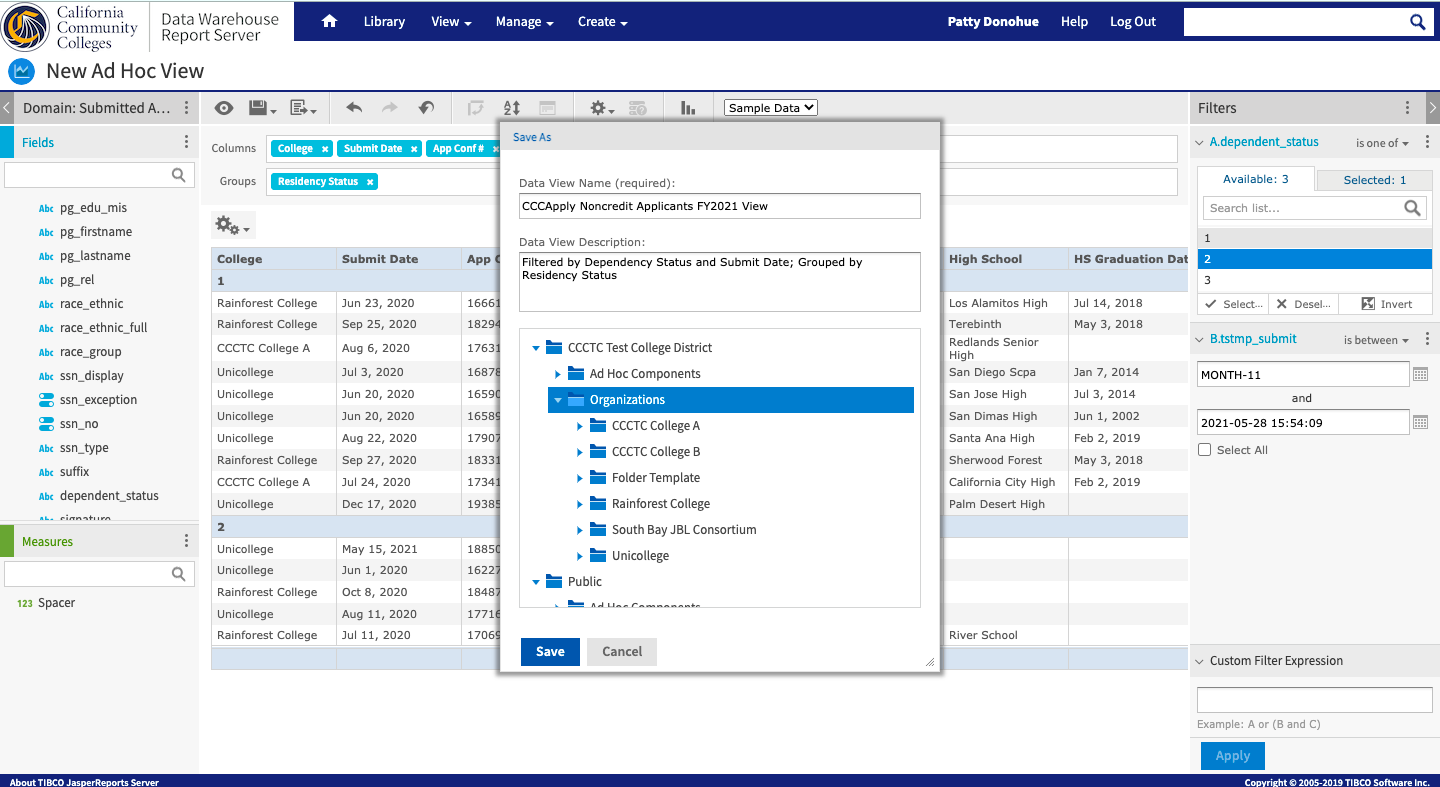 |
Export icon | select an export format option to download the report to your computer's default download location. |
Below is a screen image of a report exported in PDF format.
...
Fields, which can be added to the table as columns or groups.
Measures, which are specialized fields that contain data values.
To… | Do this… |
|---|---|
To add fields and measures as columns in your table-type ad hoc View |
|
To remove a field or measure from a table View: | In the Layout Band, click the x next to the field or measure’s name. |
To re-order the fields (columns) in your table View: | In the Columns row in the Layout Band, click and hold a field tab and drag it right or left to a new position |
Using Groups
The Group feature allows you to display detailed groups of data rows in a table View. For example, if you want to create a table View/Report that will list all the CCCApply applications submitted to your college separated by the three residency status values, you would add a group based on the “Residency Status” field - even if the field is not currently being used as a column in your table View. The applications would then be displayed as table rows and grouped into the corresponding residency status values.
The Group feature can be used with any data field included in the data source (domain or topic) selected when creating your new ad hoc View.
You can also use multiple fields to make more specific nested groups. For example, by adding a group based on the applicant’s “State” field to the table described above, the applications would be arranged by State within the residency status groups. Under the “Residency Status = 3” group header row, new header rows would appear for the different states (i.e., Alabama, Alaska, Arizona, Arkansas, and so on) with the applications submitted by students from each state appearing under their respective state names. All groups, as well as data field columns, can be sorted ascending or descending at any time - relative to their respective groupings.
Only fields can be applied to a table as a group; measures cannot be used.
Data is grouped in the table according to the order they have defined. You can change the order by dragging the groups into position if needed.
To… | Do this… | ||
|---|---|---|---|
Create a group |
| ||
Remove a group | In the Layout Band, click the x next to the field’s name in the Groups box. | ||
Move a grouping order up or down in a table | In the Layout Band, drag the name of the group you want to move into its new position. |
Displaying Summaries
You can display summary data for any column in your table. Summary data may be in the form of various functions, such as:
...
For example, in a table with a list of applications grouped by Residency status and State, you can display the number of applications submitted from each state for each residency status group, using the Summary function.
To… | Do this…. |
|---|---|
To add a summary to a specific column |
|
To remove a summary from a specific column: |
|
Column and Header Labels
You can edit a column or header label directly in the Ad Hoc Editor.
To… | Do this… |
|---|---|
Edit a column or header label |
|
Delete a column or header label: |
|
Re-apply a label: |
|
| Tip |
|---|
If space is at a premium, you can remove labels from the view. When you delete a label, it still appears when you look at the view in the Ad Hoc Editor, but does not appear when you run the report. |
...
After the report runs with input values, the Input Controls dialog box continues to display, which allows you to change the inputs, if needed. Use the table below to decide what action to take in the Input Controls dialog box.
Click this button in the Input Controls dialog box... | To... |
Apply | run the report but leave the Input Controls dialog box open |
OK | run the report and auto-close the Input Controls dialog box |
Reset | set the field values back to their default after you've edited them; the |
Cancel | close the Input Controls dialog box; click View → Repository to return to the list of data warehouse reports |
Save | to display the Save Values dialog box to save a specific value setting so you can use it easily the next time you run the report The next time you run the report, a drop-down lists displays in the upper left corner so you can select your saved value(s). |
...
| Tip |
|---|
Relative Date Filters: To filter information in your View based on a date range relative to the current system date, see Creating Filters with Relative Dates. |
| Info |
|---|
Creating Filters with Relative DatesYou can filter information in your view based on a date range relative to the current system date. You can accomplish this using date-based filters, and entering a text expression describing the relative date or date span you want to display, using the format <Keyword>+/-<Number> where:
For example, if you want to see all of the CC Promise Grant Applications submitted during the prior week, your expression would be: WEEK-1. |
...
Use the following "best practices" as outlined below when working with Views and their associated reports.
General Best Practice | Example |
View/Report Organization |
|
When Creating a View by Copying an Existing View |
|
...
Creating New Ad Hoc Reports
...